Assignment 5

Concurrent Engineering Product Design Review / Assessment and Improvements: New Product Innovation & Introduction (NPI & I) Challenges

Author: Dhananjay Mahesh Bhati

Class: IE655 Spring 2017

Email: db377@njit.edu

Date: 25th April 2017

eLearning pack ID: IE655-Spring2017-18-18

Professor: Paul G. Ranky

This assignment was completed by Dhananjay Mahesh Bhati with the help of resources from 3D e-book.

Collaborating Companies

  • SMTCL
  • KENNAMETAL
  • Niagara Cutter
  • MITSUBISHI Materials

Virtual company name: Harit Disposal Solutions LTD.

Contents:

  1. Introduction and Objectives of the Project
  2. Part 0: Rework
  3. Part 1:
    1. Innovative Green PLM Design
    2. Product/Process Innovation, Introduction Methods and Processes
    3. Green Product Innovation Introduction (NPI & I)
    4. CORA
    5. PFRA
    6. Rapid Prototyping
  4. Part 2:
    1. PLM/Digital Design, Digital Manufacturing & Sustainable Green Transition Plan
    2. Transition Plan CIMpgr
    3. Implementation of Transition Plan
    4. ROI Plan
  5. Part 3: Video Conferencing
  6. Summary
  7. Social Networking Content
  8. References

Introduction and Objectives of the Project

The assignment is divided in 4 parts:
The first part is the rework of previous assignments based on comments by the professor.
The second part is creating innovative green PLM design a new alternate product for the company using sustainable methods.
The third part is about making a PLM / digital design & digital manufacturing and sustainable green transition plan for a company of your choice PLM /Digital Design Manufacturing and Sustainable Transition Plan for our company.
In the fourth part I am discussing about the new product with a classmate using video calling with the help of SKYPE.

Part 0: Assignment rework

Assignment 0: 0/10 – https://dmbhati.wordpress.com/2017/01/28/assignment-0/
Assignment 1: 10/10
Assignment 2: 20/20
Assignment 3: 20/20
Assignment 4: 20/20

Part 1: Innovative Green PLM Design

By learning concurrent engineering course I have learned many tools and get an insight to implement the same methods to improve my products and processes. The main goal is to produce green and sustainable products. We are now planning to start an alternate process to remove contaminants and catalysts from metal, which will increase our productivity and revenue.
I’m considering to start new process to separate catalysts from huge quantities of scrap metal. But the problem in introducing new method is the capital cost. Magnetic catalysts have the benefits of easy recovery and reuse after the completion of the reactions and green chemical processes. Magnetic separation, among the various procedures for removing catalysts, not only obviates the requirement of catalyst filtration or centrifugation after the completion of reactions, but also provides a practical technique for recycling the magnetized nanostructured catalysts. The magnetic separation of catalyst involves new equipment which is necessary to magnetically remove catalysts efficiently and once separated, they can be recycled and reused.
Most of the electricity produced in the world is derived from fossil fuels. The burning of coal produces carbon dioxide which is considered as harmful Greenhouse Gas in order to solve the problem of global warming, we are considering the use of renewable sources to produce electricity. At Harit Disposal Solutions LTD. we are committed to work towards controlling the emissions, reduce the carbon foot print and introduce new green methods to advance the industry in a sustainable path. We are using latest solar collector which has enormous amount of surface area to collect solar energy. Solar energy is cheap and green source of energy. We are going to start a production line of these solar collectors working on solar energy. These solar collectors can produce energy up to 200-300 volts (minimum) depending upon their size. We are collaborating with GE electric and Nippon Rika Japan on a big scale during this project. Since GE electric can supply with all kinds of motors and frequency invertors we can use their supplies a lot. Nippon Rika will provide photovoltaic cells for solar collectors.

CORA Analysis

After carefully analysing key factors directly linked to the success of Harit Disposal Solutions LTD. and to the implementation of a greener technologies for emissions control. Harit Disposal Solutions LTD. will be implementing CORA to determine the effect of various elements to the company growth. CORA will provide us with a road map as to what are the most important parts we need to focus on in order to produce a better and greener service. Also, Harit Disposal Solutions LTD. will use CORA to better understand the costumer’s requirements and to provide successful strategic plan.

Critical Requirements of the operation are as follows:

  1. Time to process waste metal with centrifugation
  2. High quality of recycled metal that meets market demand standards
  3. Minimise waste by implementing green processes
  4. Customer  service management
  5. High quality management
  6. Latent and innovative technology
  7. Customisation
  8. Centrifugation and recycling cost
  9. Green energy utilisation
  10. Waste metal procurement
  11. Reduce Carbon footprint
  12. Ergonomics

CORA Results analysis

The priorities of each of the functional activities are ranked with Absolute Importance Rating (AIR) to give priority according to user requirements. Correlation values of 1 (Low), 3 (Medium) and 9 (High) are used by the team to prioritize the requirements. This function should be done in a team to allow better understanding and correct level of customer satisfaction required.  All requirements will be ranked depending on their importance from 1 to 5 (5 – the most important). Based on the requirements priority and correlation values the Absolute Importance Rating (AIR) will be calculated. AIR gives us quantified level of importance in terms of how engineering solution respond to specific customer need.

Following are the three main solutions:

  1. Operations efficiency
  2. Optimum Utilization
  3. R&D

Operations Efficiency has the higher AIR and therefore should be the main focus for us here at Harit Disposal Solutions LTD. it will define how well we did our job at designing and developing our network. Harit Disposal Solutions LTD. will drive these results to all departments because now we have a better understanding of what is the core of our business. This will help us to further develop a better and stronger brand.
The second solution with the higher AIR is Optimum Utilization. Apart from having an efficient operation we also need to make sure that all of our sites and hubs are well balance and therefore utilized. This will make our operation a lot smoother because it will reduce bottlenecks and constrains
R&D is the third most important solution. This will help us to put the right methods in place to ensure that our internal and external costumers will always have the best of the results. This helps us to always come up with better methods and processes to keep innovating and helping our customers and environment.
In summary of the top 3 AIR; as a metal processing and recycling company, our focus is to improve our costumer operations and maximize the profits and reduce cost. I could have not agreed more with the CORA analysis. Before we study, learn and improve a costumer’s operation we first have to make sure that our operations are running efficiently.

Process Failure Risk Analysis (PFRA)

At Harit Disposal Solutions LTD., we performed a PFRA to make sure that the processes are in place in the line of emission control standards and are optimized to yield their best possible results. In this case, we looked at all the areas we thought are of major importance in order to abate pollution in a best possible manner. The key is to make sure that the design and manufacturing process and other processes include verification controls which can identify potential failures. These criteria can then be used when deciding upon the degree of risk.
On performing PFRA, Harit Disposal Solutions LTD. observed 12 processes. The 12 processes are listed below:

  1. Examining centrifugation assembly
  2. Process waste metal with centrifugation
  3. Centrifugation process efficiency
  4. Emission standards
  5. Segregation of purified scrap metal
  6. Recycling metal
  7. Procurement of Waste Metal
  8. Disposing of coolants and oils
  9. Selective catalytic reduction
  10. Facility inspection
  11. Work force plan
  12. Staging plan

Based on the values obtained through PFRA analysis three (3) processes have high failure potential, and they are:

  1. Process waste metal with centrifugation RPN 400
  2. Recycling metal RPN 288
  3. Workforce plan RPN 300

The PFRA sheet records the failure mode and effects for each of the above steps and calculates the Risk Priority Number (RPN) associated with each failure. Higher the RPN higher is the probability that the process will cause failure. These sub processes can cause a lot of damage to company in terms of money, time, quality and reliability. So it is necessary to address these processes and find engineering solutions. The team came up with the following analysis on the above stated process to reduce the risk of the pin to fail;
All processes above require immediate reaction from our management. All the processes will be reviewed as soon as possible – audits, inspections and procedures will be created. The process which has the highest RPN (Risk Priority Number) is Processing waste metal with centrifugation. Centrifugation is crucial to our service, and as we can see process which has very high risk of failure. The management will consult with Chemical engineers and collaboration companies to create easy to follow procedures such as the proper centrifugation process, different sedimentation techniques in order to bring this risk to very low level.
The second process which has the highest risk associated with is, recycling of metal. It is very important process because it recycles the waste metal scraps, this metal is sold back to the metal industry. Management took so immediate action to address this failure. We will consult collaboration companies to find easier ways to efficiently recycle the scrap metal and possible changes to methodology might occur after consultations. Also, the employees under the recycling department will undergo rigorous training sessions.

Further work needed/proposed:

We are going to design a perfect marketing plan. We will be starting the company in US but our first target would be to make a spot in the Asian market because developing countries dump large quantities of scrap metal.

Green Product Innovation and Introduction (NPI & I) methods:

  1. http://www.mdpi.com/2073-4344/5/2/534/htm :- This paper discusses about the magnetic catalysts and how they can be separated and easily recycled and be ready for reuse.
  2. American Iron and Metal Co. (http://www.aimsolder.com/): AIM operates one shredder plant and an additional facility through which more than 365,000 tons of ferrous scrap were handled last year. AIM’s interoperability integrates into the firm’s current system environment. Implement complete solutions with applications as PLM and ERP.
  3. Triple M Metals (http://www.triplemmetal.com/): A member of the Giampaolo Group triumphed to win a 2012 Canada’s Best Managed Companies. Tube City provides scrap management, slag processing and metal recovery services to integrated steel mills, mini-mills and foundries in North America and to U.S. Steel Co. mills in Eastern Europe. Triple M Metals has Insight and Product Innovation (IPI) which helps design, management and produce better products.  It optimizes the product, process and organization as a whole.

Part 2:

PLM/Digital Design, Digital Manufacturing & Sustainable Green Transition Plan

Many companies have been utilizing the traditional engineering approach for design which involves a sequential approach where marketing obtains the requirements which are passed to the design team. Once the design is complete this is passed manufacturing, testing, and then production. When errors or changes occur it must go back to the phase that needs rework and then back through the sequential phases. This method is characterized by a lot of risk and often leads to longer product lead times and added waste. Furthermore, when a new product is launched with the traditional approach but it similar to a certain degree to an existing product the tradition approach often requires a start from scratch. Companies have started to transition to a CE/PLM based approach which involves the collaboration of all of the groups, marketing, design, manufacturing, maintenance, quality, etc. early on from conception. More importantly there is a heavy collaborative effort during design to reduce the changes of rework and errors. To go further this approach has also evolved into PLM/ Digital Design and Manufacturing. This is a similar concept as CE/PLM but it occurs on a digital platform. Software packages allow for management of the entire PLM in addition to digital modelling and designing of the product and process. Product and process information is stores in an object format which can be manipulated and modified. This type of platform allows for quick collaboration and faster design and modifications. Moreover, the information is stores and can be retrieved when a similar new product has to be developed.  Some companies have been hesitant to transition to a PLM/ Digital Design and Manufacture based company claiming that:
Implementation of PLM / Digital Design and Manufacture leads to shorter lead time of products. It engages the resources early during the design phase to ensure errors are reduced. In addition, it allows for iterative product changes and less rework and newer but similar products need to be developed. This is something Toyota has mastered and has shown for it to be profitable and results in high quality products. Therefore, although the current method works there is always a need to do it better because eventually companies will find it hard to meet the customer’s need.  When the reduction of waste and faster lead times are realized the ROI is favourable therefore the time and money invested is well worth it. Lastly, with the proper implementation plan and software choice existing files and projects can be transitioned over or may not need to be brought over depending on the company strategy.

Transition Plan and Implementation:

This is a basic layout of plan for development of new product during transition period. CIMpgr method is used to prepare a graphical prototype of transition plan.
Layer 0:
This is layer 0. It consists of the basic Inputs (I), Outputs (O), Resources (R) and Constraints (C).
Layer 1:
In this layer the entire process of the product life is shown. It starts with Research and development of product. Here the Product is developed with the help of various tools. In short an idea takes place and gets a shape, size and a name. Then in the next step a detail market analysis is done based on the product requirements. This gives an idea if the product is going to make any money or not! Once we have a detail idea for the demand of our product in market the manufacturing processes start. After the manufacturing is complete a proper marketing strategy is designed and the product is sold in the market. The final output is profit.
Return on Investments (ROI)
This is the analysis of profits or returns that EG. Inc. will get against the investment in this project. This is important to check is the project is feasible or not.
Initial Investment = $1000000
Running Costs = $500000 per year
The assembly line will be completed in 2 months. The production of the first batch will take at least 6 months. Then the marketing will start and sufficient amount of metal will be processed and recycled by the end of the year. It won’t generate any profit during the first year as the initial investment is high. But it will recover all the initial investment in the first year along with its running cost.
Profits in first year – $0
Profits in second year – $ 1000000
Profits in third year – $1000000
ROI on investment in 3 years = 200%
The profit will go on increasing as the demand increases. This will happen over a period of time as the service gets established in the market with good value. In order to achieve that we will be producing top quality recycled metal meeting our customer requirements.

Part 3: Video Conferencing and Social Networking

I conducted my video conference through skype on April 25th, 2017 with Yogesh Kannan

Untitled
The purpose of the video conference was to do product review. We discussed our products and different approaches to quality.
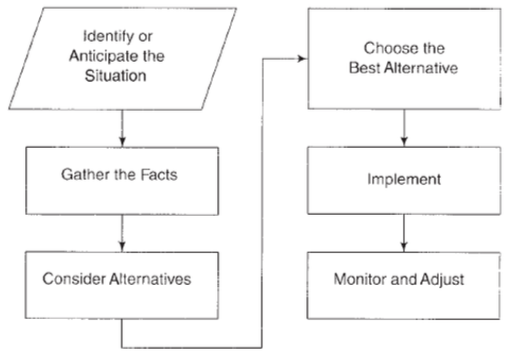
1.What is a product design review?
Product design review is an evaluation of design against its requirements in order to verify if design goals were reached.
2.How did you prepare your files for this web-based VC product design review?
Both Yogesh and I wrote short overview of our companies and we shared our web pages.
3.What were the most important steps in your product design review process?
Discussion of methodologies used during green product life cycle management. We discussed CORA, PFRA and other statistical methods.
4.What software did you use for VC and how?
The software we used for Video conferencing was Skype.
5.What did you discuss and achieve during VC session?
We discussed our product design. We concentrated on green aspects of our design such as how really green are our products and how we can improve that in future. We shared our issues about some green products such as solar cells which create a lot good things but the process of making them is extremely toxic. The biggest achievement of the VC session was to share our experience with different methods used through our projects and how we overcame some issues.
6.How do you like this video-conferencing approach for collaborative CE/PLM problem solving?
I enjoyed video conferencing approach for problem solving. The biggest advantage is that it can be done from anywhere in the world and it saves environment too.
7.What were the main challenges?
The main challenges of our assignment were to learn how to apply learnt methods to our companies.
8.What worked well, and what did not and why?
Yash really liked PFRA and he believes that it’s the most important tool learnt in class. For me, it was quality function deployment – CORA, where I could compare different customer requirements with engineering solutions.
9.In comparison to a face to face visit versus VC, what is the estimated carbon footprint saving to the environment?
Car: 2016 Honda Oddysey
Avg. MPG: 24
Distance from my home to NJIT (roundtrip): 25 miles
Carbon footprint saving: 0.0092 tons of CO­2
Yearly commute to NJIT for all my classes: 2250 miles
Yearly carbon savings (if I take all classes online): 0.82 tons of CO2
10.  What are green engineering benefits of using VC?
​By using VC we create huge carbon footprint saving especially that in many cases we can avoid flying to other country.

Summary

This assignment had the introduction of several technologies in the processes that were being used for manufacturing of our products. These technologies were introduced in all the tools that were discussed in the previous assignments. The implementation of CIMpgr Models, CORA and PFRA demonstrated a significant benefit of these Technology. At the last stage of the assignment, quality tests were performed in order to ensure continuous improvement of the company as well as better customer satisfaction and greener sustainability. The complete process was then passed through a quality test to see that all the procedures are being followed to be a sustainable organization. Application of the course tools such as CIMpgr diagrams, CORA charts, Control Charts, and PFRA charts have been employed in the company’s production processes. These techniques help reduce to defects and errors. Through Process modeling everyone in the company understands the processes that are followed during the manufacture of the product. The CORA method, helped improve the design of the service process by understanding and meeting the requirements of the customer. Lastly, the PFRA method was used to identify potential risk failures and process failures that could affect the product once it is released to end-users. By the implementation of all these techniques and technologies, the organization will continue to strive for new industrial standards and produce high quality products for total customer satisfaction. 

Social Networking

10,000 Volkswagen Diesel Vehicle Owners In UK Suing Company Over Scandal

Harcus Sinclair with Slater and Gordon have sued Volkswagen seeking compensation n thousands of British pounds for every driver/owner in the UK directly affected by the diesel emissions scandal in which company was found using defeat devices to find a way around testing regulations. About 10,000 of those affected have signed on for group action in high court.

Volkswagen representative said that the company doesn’t believe customers were negatively affected by the issue and would defend itself in court.

Click here for the reference link

Click here for discussion

Good Science Tells A Story, & Well-Written Research Has The Greatest Impact

This article illustrates that research abstracts written in a narrative style were favoured among the readers and other scientists more than the one presented in dense, weighty scientific terms.

The findings support beliefs that narrative writing holds more power than expository writing and telling a story can improve communication. But regardless, a lot of publications are written in dry and cumbersome style. According to Ryan Kelly, this style of writing is a remnant of 18th/19th century in which scientists were merely observers.

The researchers also found that the highest-rated journals tended to feature articles with more narrative content. They said they don’t know if the really top journals pick the most readable articles, and that’s why those articles are more influential, or if the more narrative papers would be influential no matter what journal they are in. The study already has received considerable attention, although not from traditional media. Rather, there has been a ton of Twitter posts from scientists.

Click here for the reference link

Click here for the discussion

Robust vs. robot learning

Machine learning is about automated systems learning to identify patterns and relationships in data using hundreds of variables. Machine’s ability to perform this kind of work dramatically outstrips the average worker’s capacity.

Insightful leaders see the value of leveraging machine learning where it makes the greatest sense and impact. But they also understand the unique contributions that are only available from the human mind and spirit.

These leaders know how to tap an unbeatable and ever-evolving competitive advantage by enabling and promoting the non-linear, abstract and creative learning and thinking capacity that resides exclusively within each employee’s brain.

Click here for the reference article

Click here for the discussion

References

1. http://www.cimwareukandusa.com/All_IE655/IE655Fall2016.html
2. E- Learning pack provided by Dr. Paul G.Ranky


Assignment 4

Sustainable Green Design for Manufacturing / Assembly / Environment Methods and Technologies Study.

Author: Dhananjay Mahesh Bhati

Class: IE655 Spring 2017

Email: db377@njit.edu

Date: 4th April 2017

eLearning pack ID: IE655-Spring2017-18-18

Professor: Paul G. Ranky

This assignment was completed by Dhananjay Mahesh Bhati with the help of resources from 3D e-book: chapter 6, 7, 8, process CORA template and Ranky – Taguchi calculator created by Paul G. Ranky.

Collaborating Companies

  • SMTCL
  • KENNAMETAL
  • Niagara Cutter
  • MITSUBISHI Materials

Virtual company name: Harit Disposal Solutions LTD.

Contents:

  1. Introduction and Objectives of the Project
  2. Brief description of the methodologies applied
  3. Sustainable Green Design Methodology and Strategy
  4. Green design and manufacturing methods
  5. Questions and Answers from Chapter 3
  6. Other Sustainable Green Product Design Methods
  7. Collaboration
  8. Social Networking Content
  9. Summary
  10. References

Introduction of the Project

The aim of Harit Disposal Solutions LTD. is to provide an efficient and smart way to manage the waste generated by the Metalworking industry. Thereby helping keep the water and soil clean and recycle waste metal. Use of metal tools and finished products sustain the world around us. We are primarily focussed on designing methodology to improve the efficiency of separating the coolant liquids and oils from the metal waste. Traditionally, the metal waste has been disposed off in the landfills. While in the soil, the toxic liquids seep into the surrounding soil and contaminate the ground water and nearby soil.

Harit Disposal Solutions LTD. does continuous research on improving the centrifugation methods. Along with that, efforts are being made to come up with an efficient methodology for the recycling process to reduce the capital and energy spent on recycling. This recycling of metal waste reduces the amount of mining and refining done every day to meet the increasing global demand for metal.

Objective

This project will focus on the selection, development and identification of sustainable green design methodology and strategies that will be implemented in Harit Disposal Solutions LTD. to ensure that there is no negative impact on environment and manufacture the product in Eco-friendly manner.

Brief description of methodologies applied

  • Deming’s 14 rules of management and quality concepts: Deming believes that the purpose of the organization is not to make profit for survival, but to provide the best service or goods at the lowest cost and complete customers satisfaction.
  • Lean Six Sigma: is a green PLM business management strategy which involves performance improvement by removing all identified waste systematically.
  • MUDA, MURA, MURI: Muda is a Japanese word meaning “futility; uselessness; wastefulness”,  as one of the three types of deviation from optimal allocation of resources. Muda is an effective way to increase profitability by eliminating waste.
  • KAISEN: is also a Japanese term and methodology based on Deming’s principles as well which is focused on gradual improvement of product and processes without losing existing improvements.
  • JIT: is a methodology aimed primarily at reducing flow times within production as well as response times from suppliers and to customers.
  • POKA-YOKE: is a Japanese term and methodology based on Deming’s principles which means to remove sources of error and build designs, systems, and processes that aim to reduce the errors humans inherently are prone to commit.

Sustainable green design methodology and strategy

Harit Disposal Solutions LTD.has been applying sustainable green design and manufacturing methods since the beginning of this project. Harit Disposal Solutions LTD. will manufacture catalyst on the environmental friendly methods and help in abating environmental and industrial pollution. To support this goal, Harit Disposal Solutions LTD. will implement KAISEN, MUDA, and POKA-YOKE strategies on this project.
Kaisen: Gradual product design and process continuous improvement with a lean approach.
KAISEN is the second strategy which will be implemented by Harit Disposal Solutions LTD.. KAISEN is also a Japanese term and methodology based on Deming’s principles as well which involves all employees from the CEO to the assembly line workers to make gradual improvements of a product or a process without losing existing improvements.
Since successful implementation requires the participation of workers in the improvement, people at all levels of our company participate in KAISEN, from the CEO down to janitorial staff, as well as our collaborative companies.
We utilize the procedure system mentioned above as well as an investigation system to analyse correct deviations and errors. When manufacturing issues result, errors in any of the processes of the PLM will be analysed and improved in a corrective action. The implementation of continuous improvement will help Harit Disposal Solutions LTD. to meet long term goals as well as improve quality beyond customer requirements.

Problems will be sorted into different categories: MUDA (waste), MURA (irregularity), MURI (strain)

MUDA, MURA, MURI
For the development and design of residential natural gas generators EG Inc. wants to stay competitive in the global market with high quality products. To achieve our strategic target we will first implement MUDA tool since MUDA is an effective way to increase profitability by eliminating waste.
In the manufacturing stage Harit Disposal Solutions LTD. uses a Japanese technique MUDA referring to gradual product design and process improvement. The three MUDA, MURA and MURI terms are one of the three types of deviation from optimal allocation of resources.

MUDA refers to waste from material, time, poor planning and poor manning. MURA refers to irregularities, differences and variability’s caused by men. MURI refers to stress and strain which could be caused by poor work conditions or perhaps disharmony amongst workers.
All real time data during the installation by automated tools are monitored and saved so that we can analyse and improve the process respectively. This allows Harit Disposal Solutions LTD. to identify and correct any flaws or deficiencies during manufacturing.
The equipment is also self-monitoring so that it can identify any potential problems before they occur. By correcting problems before they worsen, the manufacturing process is made more efficient and not prone to costly down time due to non-function equipment.
POKA-YOKE
The third strategy implemented into Harit Disposal Solutions LTD. will be POKA-YOKE.
The fundamental basis of POKA-YOKE is to respect the knowledge and experience of operators and floor workers, engineers, designers, and eliminating the chance that an error may occur by design and governing practices.
With the entire development of the process, designers will be required to incorporate the 7 areas of design. These are respectively functionality, manufacturability, assembly, maintenance, testability, environmental impact, and removal.
Its purpose is to eliminate product defects by preventing, correcting, or drawing attention to human errors as they occur. It is a crucial tool during installation process of Three way catalytic convertors (TWC).

Green design and manufacturing methods

Our recycling facilities utilise automobile shredders, aluminium shredder, balers, shears, mobile shearing, torch processing, auto crushers, and an extensive truck and railcar fleet.

Harit Disposal Solutions LTD. wants to dive deeper into the sustainable centrifugation and recycling. In order to achieve this goal, we will introduce shredders and shears with collaboration of our partners at SMTCL, KENNAMETAL, Niagara Cutter and MITSUBISHI Materials. The partnership will bring the benefit directly to client as the recycled metal is widely used in metal industry and our partners are giant metal industry companies and to get this technology worldwide accepted our partner MITSUBISHI Materials will help in publicity of our special kind of services and product which meets the international standards of   recycled metal.

Question and Answers from Chapter 3

1. What are the benefits of design for quality, manufacturing and assembly?

It is a beneficial subject for a company which has innovation and design vision to stay competitive today in the market. It brings competitive advantage, financial stability and profitability to the company. It enables for a company to put a product into a market before its competitor at a lower cost. Since the product can come to market much faster as well as with reduced costs due to the minimal changes at the design phase it improves process quality and delays.

2. What is KANRI?

KANRI is a step-by-step planning, implementation, and review process for managed change. It is a systems approach to the management of change in critical business processes. The purpose of KANRI is to make it possible to get away from the status quo and make a major performance improvement by analysing current problems and deploying in response to environmental conditions. KANRI consists of 4 major steps: PLAN, DO, CHECK, ACT. These steps help company to improve and create zero defect processes.

3. What is KAISEN?

The Sino-Japanese word “kaizen” simply means “change for better. Kaizen is a daily process, the purpose of which goes beyond simple productivity improvement. It is also a process that, when done correctly, humanizes the workplace, eliminates overly hard work, and teaches people how to perform experiments on their work using the scientific method and how to learn to spot and eliminate waste in business processes.

4. Explain difference between MUDA, MURA, MURI?

MUDA, MURA and MURI are three different classification of problems found during processes;
MUDA is a Japanese word meaning “futility; uselessness; wastefulness”.
MURA is a Japanese word meaning “unevenness; irregularity; lack of uniformity; non uniformity; inequality”.
MURI is a Japanese word meaning “unreasonableness; impossible; beyond one’s power; too difficult; by force; perforce; forcibly; compulsorily; excessiveness; immoderation.

5. What is POKA-YOKE?

POKA YOKE is a Japanese term that means “mistake-proofing”. A Poka-Yoke is any mechanism in a lean manufacturing process that helps an equipment operator avoid (Yokeru) mistakes (Poka). Its purpose is to eliminate product defects by preventing, correcting, or drawing attention to human errors as they occur.

6. What is Quality Circle?

A quality circle is a group of workers who do the same or similar work, who meet regularly to identify, analyse and solve work-related problems. Normally small in size, the group is usually led by a supervisor or manager and presents its solutions to management; where possible, workers implement the solutions themselves in order to improve the performance of the organization and motivate employees.

7. What are some of the most important factors of quality circles?

Quality consciousness, Self-development, voluntary activities and participation by everyone are some of the most important factors of quality circle.

8. What is the best principle or technique that best provide unobstructed access to robotized assembly lines?

The best way to feed a robotized assembly line is by following the layered, vertical access and stacked assembly principle.

9. What are the benefits of a rigid part over a flexible one on a robotized assembly line?

Flexible parts, such as cables, wires, belts are more difficult to handle and assemble than rigid parts because the position and orientation of the part varies during handling.

10.Why we should design symmetrical parts?

Symmetrical parts increase assembly reliability and quality, in particular if the processes are automated, because they reduce the possibility of mating parts in the wrong orientation.

Other Sustainable Green Product Design Methods

Packaging Method (PM) and Low Cost of Operation: Improvements to both a green profile and the bottom line can be brought about using PLM. More intelligent packaging means lower transportation costs per unit as either the amount transported can be increased or the amount of transport needed can be reduced. The centrifugation can be performed on a larger amount of metal.

Principle: The main principle of this method is use the alternate metal with having low cost, abundant and must have high conversion rate and can sustain for long time without degradation.

Application in Harit Disposal Solutions LTD.: This method has it applications extensively in centrifugation and recycling. Where this method will be applied so that lot of material is supplied in one go and the operation is environment friendly.

Collaboration

Harit Disposal Solutions LTD. EG.Inc. values the inputs of its partners. Niagra cutters have agreed to provide best performing machines conducting intense R&D at our facility. MITSUBISHI Materials will provide us insight into pollution level of water bodies in order to save marine life. Effective market research, productivity solutions and optimization of technology will be carried out SMTCL to mitigate the present day environmental problems by working on efficient centrifugation technology and recycling to recycle the precious metals like platinum and palladium.

Social Networking

5 sustainable packaging trends to watch in 2017

This article illustrates how the companies have shifted their attention to packaging, in addition to focussing on product and image. A lot of waste comes from disposing packaging, most of which is sent to landfills. This is the reason why sustainable packaging has gained tremendous popularity.

Labelling can make it clear on the product packaging on how to dispose it and clarify if there are any sustainable claims. With increased transparency, companies can help in informing their customers on how to recycle the product packaging or how to dispose of it properly. Lightweight packaging would need less material to produce packages, the manufacturing costs are low, the environmental impact from transport is minimized and the waste sent to the landfills is reduced. The easiest way to ensure that the packaging creates the least impact on the planet is by manufacturing it using recyclable materials such as cardboard, paper, recyclable plastic, etc.

Edible packaging is all about eliminating the packaging waste altogether. This is a conscious effort made by several companies to reduce the overall plastics and paper waste. It’s still in the nascent stages of planning and execution but it definitely is gaining speed and interests among numerous companies despite mass commercialization being quite distant. Opting for minimalistic packaging that ranks high on aesthetics as well as design aspects. Ditch bulky packages and it won’t be long before the customers also take notice of how the product provides better value.

Click here for the reference link

Click here for the discussion

EPA accuses Fiat Chrysler of excess diesel emissions

The U.S. Environmental Protection Agency on Thursday doled out a maximum fine of $4.6 billion Fiat Chrysler Automobiles NV of illegally using hidden software to allow excess diesel emissions to go undetected.

Fiat Chrysler Chief Executive Sergio Marchionne rejected the allegations at a conference call with reporters, saying there was no wrongdoing and the company never attempted to create software to cheat emissions rules by detecting when the vehicle was in test mode. He said the EPA and the company could have settled the issue in an efficient way without the EPA announcement.

The EPA said it found at least eight undisclosed pieces of software that can alter how a vehicle emits air pollution. Fiat Chrysler had recalled vehicles for one of the undisclosed software. Fiat Chrysler could face fines of $44,539 per vehicle if it is proven that it violated emissions rules.

Click here for the reference article

Click here for the discussion

Total Corporate Solar Funding Drops 64% In 2016, According To Mercom

Total corporate funding in the solar sector throughout 2016 mounted up to $9.1 billion, a 64% decrease in funding from 2015, according to a report from Mercom Capital Group. According to Mercom’s quarter-by-quarter analysis through the year, solar funding for the first, second, and third quarter all reported significant drops over their respective year-earlier companions.

Public market financing fell to $1.8 billion over 27 deals, compared to $6 billion over 38 deals in 2015. Three IPOs brought in $230 million, while four yields raised public market financing. Debt financing in 2016 reached $6 billion, compared to $18.3 billion a year earlier. Announced large-scale project funding reached $9.4 billion in 2016 over 133 deals, compared to $11.6 billion over 124 deals in 2015. The top investor for large-scale project funding was Santaner, which invested in eight different projects.

Click here for the reference link

Click here for the discussion

Summary

This project helped to get a better understanding of Poka-Yoke, KAIZEN, MUDA, MURA, MURI and KANRI and also all other aspects involved in developing sustainable green products.

References


Assignment 3

Author: Dhananjay Mahesh Bhati

Class: IE655 Spring 2017

Date: 21st March 2017

eLearning pack ID: IE655-Spring2017-18-18

Professor: Paul G. Ranky

Collaborating Companies

  • SMTCL
  • KENNAMETAL
  • Niagara Cutter
  • MITSUBISHI Materials

Virtual company name: Harit Disposal Solutions LTD.

This assignment was completed by Dhananjay Mahesh Bhati with the help of resources from 3D e-book.

Contents

  1. Introduction &Objectives of Project
  2. Description of methodology applied
  3. Main Body of the Project
    1. FMEA/DFRA
    2. Main process failure modes for the images
    3. Potential failure modes for the images
    4. Reliability analysis – Beta ver. Ranky – Weibull Calculator
    5. Collaboration
  4. Social networking
  5. Summary
  6. Further Work Needed
  7. References

Introduction and Objectives of the project

The aim of Harit Disposal Solutions LTD. is to provide an efficient and smart way to manage the waste generated by the Metalworking industry. Thereby helping keep the water and soil clean and recycle waste metal. Use of metal tools and finished products sustain the world around us. We are primarily focussed on designing methodology to improve the efficiency of separating the coolant liquids and oils from the metal waste. Traditionally, the metal waste has been disposed off in the landfills. While in the soil, the toxic liquids seep into the surrounding soil and contaminate the ground water and nearby soil.

Harit Disposal Solutions LTD. does continuous research on improving the centrifugation methods. Along with that, efforts are being made to come up with an efficient methodology for the recycling process to reduce the capital and energy spent on recycling. This recycling of metal waste reduces the amount of mining and refining done every day to meet the increasing global demand for metal. The purpose of this project is to use risk analysis methods and apply the same to the EG Inc. The risk analysis methods consist of following parameters:

  1. Process Failure Risk Analysis (PFRA)
  2. Disassembly Process Failure Risk Analysis (DFRA)
  3. Ranky-Weibull Analysis

In order to thrive for excellence EG Inc. will implement these techniques and analyse the failure modes.

Description of Methodologies Applied

The method used to complete this project/assignment is:
Failure Mode Effects Analysis (FMEA) is a methodology which focuses on lowering cost of product development by monitoring and detecting failure modes.
Process Failure Risk Analysis (PFRA) is a tool which FMEA to analyse Process Failure Risk Analysis is used to identify and minimize potential failure risks in the process. PFRA is applied during the planning phase and upgraded during the life cycle for further improvements.
The PFRA has a quantitative approach to determine and reduce potential failures in risk during the planning stage. The analysis is based on ranking potential risks on a scale of 1 to 10 where 1 is the least severe and 10 is the most severe.
Ranky-Weibull calculator is statistical method which helps to study product’s reliability over its product life cycle.

Main Body

Process Failure Risk Analysis (PFRA)

At Harit Disposal Solutions LTD., we performed a PFRA to make sure that the processes are in place in the line of emission control standards and are optimized to yield their best possible results. In this case, we looked at all the areas we thought are of major importance in order to abate pollution in a best possible manner. The key is to make sure that the design and manufacturing process and other processes include verification controls which can identify potential failures. These criteria can then be used when deciding upon the degree of risk.
On performing PFRA, Harit Disposal Solutions LTD. observed 12 processes. The 12 processes are listed below:

  1. Examining centrifugation assembly
  2. Process waste metal with centrifugation
  3. Centrifugation process efficiency
  4. Emission standards
  5. Segregation of purified scrap metal
  6. Recycling metal
  7. Procurement of Waste Metal
  8. Disposing of coolants and oils
  9. Selective catalytic reduction
  10. Facility inspection
  11. Work force plan
  12. Staging plan

pfra_hds

Based on the values obtained through PFRA analysis three (3) processes have high failure potential, and they are:

  1. Process waste metal with centrifugation RPN 400
  2. Recycling metal RPN 288
  3. Workforce plan RPN 300

The PFRA sheet records the failure mode and effects for each of the above steps and calculates the Risk Priority Number (RPN) associated with each failure. Higher the RPN higher is the probability that the process will cause failure. These sub processes can cause a lot of damage to company in terms of money, time, quality and reliability. So it is necessary to address these processes and find engineering solutions. The team came up with the following analysis on the above stated process to reduce the risk of the pin to fail;
All processes above require immediate reaction from our management. All the processes will be reviewed as soon as possible – audits, inspections and procedures will be created. The process which has the highest RPN (Risk Priority Number) is Processing waste metal with centrifugation. Centrifugation is crucial to our service, and as we can see process which has very high risk of failure. The management will consult with Chemical engineers and collaboration companies to create easy to follow procedures such as the proper centrifugation process, different sedimentation techniques in order to bring this risk to very low level.
The second process which has the highest risk associated with is, recycling of metal. It is very important process because it recycles the waste metal scraps, this metal is sold back to the metal industry. Management took so immediate action to address this failure. We will consult collaboration companies to find easier ways to efficiently recycle the scrap metal and possible changes to methodology might occur after consultations. Also, the employees under the recycling department will undergo rigorous training sessions.

Potential failure modes for the images from chapter 4 in the eBook

2153072

Image 1684

This image is of underwater camera housing. At first it appears to be very bulky and due to poor material selection some screws appears to be rusted  and there is a possibility that due to poor customer care the rusted screw would break and the clamped component might come out. Screw might have got rusted due to reaction with saline water. Materials should be carefully selected for components that are exposed to water continuously. Thereby one can reduce the failure risk of a component.

Image 1685

The glass of the underwater camera housing appears to be damaged due to poor customer care or the case of poor material selection. I assume that both have contributed equally to the current state of the glass cover. Pro-divers dive in deep sea water along with their underwater camera housing to capture captivating marine life. The pressure in deep sea water is on the higher side, thus there is a possibility that the slightly damaged glass cover of the camera housing can break due to water pressure and the inside camera can get spoilt.

Image 1688

The scratching of  glass cover due to difficult operations involved  while using it in underwater. This is a typical design mistake. There are corrals, rocks, dark and small caves that divers might want to take pictures and the material of the glass should have been properly selected. Selection of Scratch proof material will be best option in order to cope with this kind of problem.

Image 1689

This is an image of Housing for a digital camera used for underwater photography. It seems like heavy and bulky. Design is not done carefully and customer requirements are not taken into consideration properly.

Image 1692

The lens covering should be mounted safely and care should be taken that it is tight enough. There are control buttons used to control the camera inside but gaskets around these buttons might fail due to scratches on the glass surface.

Image 1693

An image of housing for a digital camera used for underwater photography but top back view is shown in the picture. It is not durable and the glass used is not water resistant as it is visible from the image. Also the glass contains lot of scratches which specifies constant wear and tear. The frame given to support the housing should be properly screwed to the housing. Customer requirements cannot be met by producing such products which are not sustainable. It also shows company’s lack of planning.

Image 1695

This image shows flash light unit that some of the component parts exposed to the harsh condition which will render it ineffective. This is due to failure to investigate and decide based on the flush light’s application, where it would be used. In this case, this product will barely function according to the customer requirement.

Image 1696

This image shows a poor design judgment. The designer lost touch with the property of beauty. The design doesn’t look any beautiful, and the sub-parts do not look the same, a defect that might have been caused by poor machining, and then ignored. This part lacked the quality check up.

Image 1697

Picture reveals the manufacturer`s lacked total quality management in their organization. Poor plastic moulding quality, lack of quality control process and wrong material selection. It has to be made of hard plastic durable of saline water applications.

Image 1698

This image shows poor choice of material. The parts are assembled using a metal screw which can easily cause wearing of the plastic part. The plastic washer might fail if the customer wants to tighten.

Image 1699, Image 1701

Pins seem fragile and do not have proper housing to support it. Loose connectivity is inevitable due to design of the pins. The rubber base has worn out indicating it will not fit anywhere due extreme wear and tear. Necessary actions must be taken by the PFRA team to solve this problem.

Image 1702

This image shows the battery cover which looks like it will lack quality when exposed to extreme pressure of water currents. If this happens then the battery will get exposed to the water thereby damaging it and eventually cutting the source to the digital camera. The manufacturing team will have to produce high water resistant covers for the batteries.

Image 1703

This is an image of connector of the battery which is the source to the underwater digital camera. As we can see from the image that the connector can be easily be dislodged from the rubber base due to high pressure under the water, so the severity rating is pretty high and also the pins are very sensitive, therefore immediate action is necessary. This image depicts poor quality while manufacturing and also lack of knowledge.

Image 1704

This is also an image of connector of the battery which is the source to the underwater digital camera. As we can see from the image that the connector can be easily be dislodged cutting the source to the camera due to high pressure under the water, so the severity rating is pretty high, therefore immediate action is necessary. This image depicts poor quality while manufacturing and also lack of knowledge.

RANKY-WEIBULL CALCULATOR:

The Ranky-Weibull distribution calculator can be used to characterize failure distributions in all three phases of the robot. It has two basic parameters namely the shape parameter, termed beta (β), and a scale parameter, termed alpha (α).
Analysis of the calculations:

  1. The average time to failure for 30 samples was 2.9449 sec.
  2. The Weibull characteristic life, α, is the measure of the spread within the distribution of the data which is 2.49.
  3. The Weibull shape parameter, β, indicates whether the failure rate is increasing, constant, or decreasing.
  4. β > 1 indicates the samples have a increasing failure rate.
  5. β = 1 indicates the prototype has a constant failure rate.
  6. β > 1 indicates the prototype has an increasing failure rate.

Thus in this case we can conclude that since β is 1.09, the samples have an increasing failure rate.

ranky-weibull_calculator

Collaboration Effort

After having used PFRA and Ranky-Weibull Analysis, we have a better understanding of the potential weaknesses in the manufacturing process involved and will work with our collaborating companies to find out and eliminate these discrepancies and work towards optimization of the process. With this analysis we have identified areas in our company which could lead to potential loss and worked towards its optimization

Social Networking Article

Looking To Shanghai: Best Practices For Inspiring A Transit-Oriented Generation (Masdar Blogging Contest Entry)

The author conveys that the transit systems represent a pathway for turning the opportunity of global urban migration into a meaningful reduction and potential elimination of transportation sector carbon emissions, which make up 26% of US greenhouse gas emissions. The realities of climate change are widely accepted among the younger generation z and they are prepared to take action. Perhaps the most important action young people are ready to take is to choose public transit over private transportation. Unlike their Gen X parents, members of Generation Z are willing to take the train or bus, and to live in denser areas closer to public transportation options. But the half a century old transit infrastructure doesn’t exactly enthuse the young people to use the public transport.

Shanghai’s Metro system and Maglev train should be considered paradigms for sustainable transport in growing cities. Here, the technology of the system fosters high ridership. The Metro runs with efficiency and speed. LED signs and cutting-edge passenger information systems utilize tracking hardware to provide up-to-the-second train arrival updates. Technology aboard the train cars run frequent diagnostics and detect faults that reduce delays and have all but eliminated the disabled trains and equipment failures so common to American systems. Since its inception in 1995, the Shanghai Metro has experienced only two significant technological malfunctions affecting service. As a result, the trains run quickly and provide uninterrupted efficient transportation across the city for nearly 8.5 million riders per day.

Maglev trains connecting Shanghai to its suburban airport are a means of sustainable urban transport. They can run on clean electricity and magnetic levitation ensures that there’s minimal land and noise pollution.

Young citizens await a viable public transportation option. They are ready to embrace automobile-free living, and must be encouraged to do so.

Click here for reference article

Click here for the discussion

The Electric Grid, Prosumers, & Climate Change Risks

The transition to a low-carbon world implies switching to a fuel source that is not only environment friendly but is free, thereby reducing the overall operational costs in the long run. In most parts of the world, the electric grid is predominantly unidirectional with a small percentage of bidirectional flow originating from grid-connected rooftop systems. Even with increases in renewable energy in the grid, the impact on climate change mitigation will remain insignificant if the end consumer doesn’t interact with the system.

Installing distributed energy systems like solar photovoltaic panels empowers people to shift from being a passive consumer of electricity to a “Prosumer” who sells power to the utility. the real potential of such systems will be leveraged when technological advancements like smart grids are in place and smart meters are the norm.

Renewable energy is intermittent. In an ideal case, we would prefer power production at times when we consume. In the real world, to meet power demand when renewable energy generation is low, there is a need to look for alternatives, which is generally fossil fuel power plants.

In order to mitigate the potential damage caused by these scenarios, it is critical to ensure the fossil fuel powered plants are not turned on, let alone operated at a lower efficiency, thereby compounding the damage. Battery storage will be a key breakthrough, but unless the devices and the grid are in place, the net effect of energy storage will be minimal.

Click here for the reference link

Click here for the discussion

EPA locks in 2025 fuel efficiency rules

EPA chief has finalized the landmark fuel efficiency rules initiated by President Barack Obama locking them through 2025. McCarthy said in her statement that the rules are feasible, practical and appropriate, also in the best interest of the industry.

President Obama announced in 2011 that automakers agree to raise the fuel efficiency to 54.5 miles per gallon. This the administration said would save the motorists $1.7 trillion in fuel costs but cost auto industry $200 billion over 13 years. Auto makers have criticised this decision. They’ve appealed to President Donald Trump to review the rules.

Environmentalists on the other hand have wholeheartedly praised this decision. Union of Concerned Scientists have said that the automakers have the technology to progress in cost-effective ways and can reduce oil usage by 2.4 million barrels a day.

Legal experts have said that it will be difficult for the Trump administration to undo the regulatory actions issued by the Obama administration.

Click here for the reference article

Click here for the discussion

Summary

From this assignment we were able to understand the need and use of failure analysis. We understood how to identify potential failures in a particular process and then decide where or not it will fail. With this exercise we now have a better understanding on how to identify and eliminate errors and failures and work towards an optimized process environment.

Further Work Needed/Proposed

After this exercise we will make sure that we implement and record our analysis and then improve the overall process with the aim to eliminate failures in the product and develop products with best quality and very good customer satisfaction.

References

Assignment 2

Author: Dhananjay Mahesh Bhati

Class: IE655 Spring 2017

Email: db377@njit.edu

Date: 27th February 2017

eLearning pack ID: IE655-Spring2017-18-18

Professor: Paul G. Ranky

This assignment was completed by Dhananjay Mahesh Bhati with the help of resources from 3D e-book: chapter 6, 7, 8, process CORA template and Ranky – Taguchi calculator created by Paul G. Ranky.

Collaborating Companies

  • SMTCL
  • KENNAMETAL
  • Niagara Cutter
  • MITSUBISHI Materials

Virtual company name: Harit Disposal Solutions LTD.

Contents

  1. Introduction & Objectives of Project
  2. Description of Methodology Applied
  3. Main Body of Project
    • Customer Requirements Based on the Images
    • CORA Product Requirement Model
    • CORA
    • Main Solution Process
    • Analysis of CORA Results
    • Ranky- Taguchi Calculator
  4. Collaboration
  5. Summary
  6. Further work proposed
  7. Social Networking
  8. Reference

1. Introduction

The aim of Harit Disposal Solutions LTD. is to provide an efficient and smart way to manage the waste generated by the Metalworking industry. Thereby helping keep the water and soil clean and recycle waste metal. Use of metal tools and finished products sustain the world around us. We are primarily focussed on designing methodology to improve the efficiency of separating the coolant liquids and oils from the metal waste. Traditionally, the metal waste has been disposed off in the landfills. While in the soil, the toxic liquids seep into the surrounding soil and contaminate the ground water and nearby soil.

Harit Disposal Solutions LTD. does continuous research on improving the centrifugation methods. Along with that, efforts are being made to come up with an efficient methodology for the recycling process to reduce the capital and energy spent on recycling. This recycling of metal waste reduces the amount of mining and refining done every day to meet the increasing global demand for metal.

Objectives

The objective of this project is to understand the customer better, by analyzing their requirements using CORA (Customer Oriented Requirements Analysis). For this analysis we will use the CORA tool and Ranky-Taguchi calculator which will help S2S.Inc to obtain a deeper understanding of the customer requirement and highlight the crucial ones.

2. Description of Methodology applied

CORA (Component Oriented Requirements Analysis) – it is a systematic and customizable method based on QFD (Quality Function Deployment) and other methods developed by Dr. Ranky to analyse products, processes, total quality management needs including products, processes and services.
CORA is divided in four different modules:

  1. User Requirements.
  2. Engineering Solutions.
  3. Parameter calculations.
  4.  Bench-marking.

3. Main Body of the Project

Customer Requirements Based on the Images from the 3D eBook

1580491_orig

The image above shows a boat propulsion blade. The element appears to sit on open air and has signs of saline corrosion. This is a case of poor material selection. The customer requirement would be to have better storage units and select better materials with higher resistance to saline corrosion.

3442855_orig

The picture demonstrates a great illustration of poor workmanship on this specific item. The screw ought to have safely cinched the connection pole, yet it is forgotten. This could prompt disastrous disappointment and this could have been effectively revised with legitimate quality checks before giving it over to the client.

960563_orig

According to the above image, it looks like the problem is with the poor selection of wood, the processing of the material, and the finishing wood used. Again the expectation of the customer here is believed to be one of durability with regards to the relative life span of the products. Total Quality Management (TQM) plays a great role here, which would have led to the selection of the appropriate type of wood that will withstand the intended atmospheric conditions.

As per the images above, the selection of wood and there is no proper finishing of wood before it got painted that’s why the paint has been removed from the wood. Again the durability of wood is also reduced and the life span is shorter. The paint applied is of low quality and it goes off when it comes in contact with environmental conditions. TQM strategies should be applied to overcome these kind of problems.

These images above show the rusted steel in the walking area of this dock structure, and the primary reason is because the steel sections of the structure are being degraded due to corrosion and rust. The manufacturing and engineering process of type of structure requires the use of the TQM and PLM concepts at all stages. Most docks use wood in the entire structural outlay to avoid this type of structural breakdown due to corrosion and rust. The customers requirement in this area would have been a sustainable product against environmental effects.

These pictures show harmed watercraft motor parts. It is clear from the pictures that the fundamental driver for these harm is rusting. Again for this situation too the makers ought to have picked the fitting material for these parts which can shield itself from rusting or give a covering to abstain from rusting. Without these measures the life of these segments descends and brings about misuse of material.

CORA Product Requirements Model

Harit Disposal Solutions LTD has constructed a CORA model using the CORA template.

The methodology of CORA involves 3 main stages.:

  • Define Purpose: This defines responsibility of the team to analyse the given system which is to be designed.  Equally, it is important to realize that the scope and the function of CORA changes as it is applied at different levels and stages of any processes. Finally, the extent of analysis must be defined.
  • Identify User Requirements: At this stage, the team collects all clear, realistic and accurate user requirements. These will be entered on the left hand side of the spreadsheet.
  • Prioritize Potential Requirements: This activity contains the ranking of the identified user requirements based on importance of each. This analysis allows highest customer satisfaction as it focuses on the key issues and offers a traceable path from the customer to the most detailed processes, throughout each stage of the development cycle. In order to quantify the information above, correlation values are set in the CORA matrix: 1 is ‘low level correlation’, or 3 is ‘medium level correlation’, or 9 is ‘high level correlation’.

Critical Requirements of the operation are as follows:

  1. Time to process waste metal with centrifugation
  2. High quality of recycled metal that meets market demand standards
  3. Minimise waste by implementing green processes
  4. Customer  service management
  5. High quality management
  6. Latent and innovative technology
  7. Customisation
  8. Centrifugation and recycling cost
  9. Green energy utilisation
  10. Waste metal procurement
  11. Reduce Carbon footprint
  12. Ergonomics

Main Solution Process:

The main Sustainable, Green CE and PLM process targets environment and customer oriented quality and functional requirements. Integrated Sustainable, Green CE and PLM process controls the contaminant removal from metal and recycling process in order to achieve the targeted deliverable. The process Sustainable, Green CE and PLM utilizes several resources under an optimized system in order to produce several deliverable such as documentation, operational excellence, reliability, high quality, sustainability and customer satisfaction.

Analysis of CORA Results:

Critical Requirements and assigned priority levels:

  1. Time to process waste metal with centrifugation: 4
  2. High quality of recycled metal that meets market demand standards: 5
  3. Minimise waste by implementing green processes: 4
  4. Customer  service management: 5
  5. High quality management:5
  6. Latent and innovative technology:3
  7. Customisation:4
  8. Centrifugation and recycling cost: 5
  9. Green energy utilisation: 4
  10. Waste metal procurement:4
  11. Reduce Carbon footprint: 5
  12. Ergonomics: 4

Following is the CORA spreadsheet for Harit solutions Ltd.

assignment2cora

After analysis of CORA excel sheet the CORA team will focus on higher Absolute Importance  Rating (AIR) value. This value will help the company to improve continuously by satisfying customer requirements with the highest AIR value and ultimately lowest through engineering solutions.

The Highest AIR Values

Following are the AIR values Observed:

  1. Operations efficiency 332
  2. Optimum Utilization 326
  3. R&D 318

These three solutions are the most important solutions to meet the customer requirements. Attaining the company of goal of attaining customer defined quality and functional requirements will be possible only through focusing on the above three solutions.

Optimum Utilization: (AIR Value 326)

This engineering solution has the maximum absolute importance rating. Appropriate process planning and use of high precision machines will help optimum utilization of material. The company focuses on operational accuracy and minimizes the waste.

Operations efficiency: (AIR 332)

This engineering solution has the maximum absolute importance rating. Operations Efficiency is the capability of an enterprise to deliver products or services to its customers in the most cost-effective manner possible while still ensuring the high quality of its products, service and support. The AIR shows that it has high operations efficiency which help the organisation to compete in the global market

Research and development: (AIR 318)

Since the customers requirement keeps on changing with the time as the technological trends advance up. New R&D methods will help the firm to meet the customer’s demands and stay competitive in the market, Initiative for improving the R&D will be taken into consideration.

The engineering solution with correlation “9” indicates that it is the most important and essential solution for the corresponding customer requirement. Engineering solutions which have a high correlation to the customer requirements are essential for the company in order to satisfy the customers and gain their goodwill. So it is very important to focus on such engineering solutions with high AIR value.

Ranky – Taguchi Calculator:
Ranky-Taguchi calculator was used to derive the Signal to Noise Ratio for quality assurance factor in the CORA spreadsheet. Ranky -Taguchi calculator is used to determine an optimum set of experiments to obtain the results and hence decide on the best choices of the parameters. The above experiments were conducted under accelerated test conditions.

We have identified all the critical requirements and satisfied most. CORA is a very valuable tool in understanding and determining all of the customer requirements.  We can continue to improve the process; adding more effective engineering controls to better meet customer needs and deleting those no longer meet the demands.

Following is the Ranky – Taguchi Calculator excel sheet:

ranky-taguchi_calculator

4. Collaboration Effort

With the analysis results we have discussed with our collaborating companies as to what our prime focus must be and how we can improve them. Niagra cutters have agreed to provide best performing machines conducting intense R&D at our facility. Also our main focus, which was sustainable development is also being implemented on a larger scale. Also we will be focussing more on product lifecycle management in order to get our customers the best product with highest tool life.

5. Social Networking Articles

Tidal lagoons could play significant role in UK decarbonisation plans

An independent review by UK’s former energy minister Charles Hendry on the potential role of tidal lagoons in UK;s decarbonised energy mix has concluded that they could prove to be a cost effective and secure supply of decarbonised electricity. UK is known to have the second largest tidal range in the world after Canada. Hendry concludes that tidal lagoons would provide security in supply and enable the country to deliver on decarbonisation commitments and also bring substantial opportunities for the supply chain.

He states that one of the great advantages of tidal energy is that it’s completely predictable, since we know when the tides are going to be every day, so it can play an important role in meeting security of supply.

A separate study by Aurora Energy research concluded that tidal energy could provide at least 10% of UK’s power by 2030. CO2 emissions could be reduced by 36% relative to a scenario where tidal power generation is not developed. In regards to the pathfinder tidal project, Hendry explains that a smaller pathfinder project needs to be operational before moving onto the larger one. This smaller project would provide experience in operating larger projects. This means that the government would need a long term strategy in favour of tidal lagoons will be needed.

Click here for the reference article.

Click here for the discussion.

New US Electricity Transmission Additions could have significant impact for wind energy

A report published by the US Energy Department Authored by National Renewable Energy Laboratory (NREL) has shown that a limited increase in America’s electricity transmission network could make the country source 20% electricity by 2030 and 35% by 2050 from wind. This would result in a consumer savings increase at $2.3 – $3.4 billion annually. Investments in America’s electricity transmission infrastructure could upgrade the archaic electric grid, saving consumers billions of dollars and creating jobs.

The report proposes three transmission expansion scenarios which add four new transmission capacity. These four lines would reduce annual curtailment by approximately half and they’d have high utilisation factors.

Click here for the reference article.

Click here for the discussion

The Durabulb LED lightbulb delivers improvement in unexpected places.

Lighting science has produced a durable lightbulb which can excel in all environments, especially where fragile glass bulb couldn’t fare well and pose a safety risk. Durabulb LED bulb can be used in industrial scenarios, garages and place where workers could be hit by the glass.

With the durabulb so rugged, it doesn’t require dense packaging for shipping, allowing it to be shipped in a much tighter formation and eliminating any breakage. Apart from being durable and rugged, durabulb provides the same look and feel of a bulb that consumers have grown accustomed to.

Click here for the reference article.

Click here for the discussion.

6. Summary

The project was very important for me because it encouraged my research on Quality Function Deployment. I believe that I have now good understanding of statistical tools which can be used to understand customer requirements.

7. Further work needed / proposed

I am going to spend more time on studying QFD tools, and investigate similar tools to Ranky-Taguchi calculator which I believe our very important in designing processes and picking right components for every project or product.

8. References and Bibliography

  1. Concurrent/Simultaneous Engineering Methods, Tools and case studies within a sustainable, globally collaborative Green PLM framework, provided by Dr. Ranky, PhD, published by CIMware USA,Inc. and CIMware LTD, UK
  2. IE 655, Concurrent Engineering, elearning pack by Prof. Ranky
  3. http://www.cimwareukandusa.com

Assignment 1

Project Title: Concurrent Engineering Video Lectures and 3-D eBook reading/study

Importance of Concurrent Engineering (CE) and Green PLM ( Product Lifecycle Management)

Author: Dhananjay Mahesh Bhati

Class: IE655 Spring 2017

Email: db377@njit.edu

Date: 14th February 2017

eLearning pack ID: IE655-Spring2017-18-18

Professor: Paul G. Ranky

Collaborating Companies

  • SMTCL
  • KENNAMETAL
  • Niagara Cutter
  • MITSUBISHI Materials

Virtual company name: Harit Disposal Solutions LTD.

Contents

  1. Introduction and Objectives
  2. Methodologies applied
  3. Main body of the project
    1. Study of CE/PLM Lecture and software demo videos
    2. What are CE and PLM?
    3. What is the difference between CE and PLM?
    4. What is green sustainable PLM?
    5. What is digital design and manufacture and why is this a huge opportunity?
    6. How is digital design integrated with digital manufacturing in PLM?
    7. What is front loading and why is it critical to understand the process?
    8. Questions from chapter 1, 2 & 3
  4. Social Networking
  5. Summary
  6. Further work needed
  7. References

1. Introduction

The aim of Harit Disposal Solutions LTD. is to provide an efficient and smart way to manage the waste generated by the Metalworking industry. Thereby helping keep the water and soil clean and recycle waste metal. Use of metal tools and finished products sustain the world around us. We are primarily focussed on designing methodology to improve the efficiency of separating the coolant liquids and oils from the metal waste. Traditionally, the metal waste has been disposed off in the landfills. While in the soil, the toxic liquids seep into the surrounding soil and contaminate the ground water and nearby soil.

Harit Disposal Solutions LTD. does continuous research on improving the centrifugation methods. Along with that, efforts are being made to come up with an efficient methodology for the recycling process to reduce the capital and energy spent on recycling. This recycling of metal waste reduces the amount of mining and refining done every day to meet the increasing global demand for metal.

Objectives

The main objective of this task is to read and comprehend the management ideologies provided in Chapters 1, 2 and 3 in the eBook and the videos included.

The concepts present are as follows:

  • CE – Concurrent Engineering
  • PLM – Product Life Cycle Management

A consistent improvement as far as useful necessities and client fulfilment is the primary goal of us at Harit Disposal Solutions LTD. These ideas will then be connected in our association. We will utilize these procedures to apply Sustainable, Green CE and PLM practices to the operations of Harit Disposal Solutions LTD.

2.  Methodologies Applied

  1. Eco-friendly operation.

  2. Use CE and PLM principles throughout the entire process.

    • PLM is a strategic business approach that applies a consistent set of business solutions in support of the collaborative creation, management, dissemination, and use of product definition information across the extended enterprise, and spanning from product concept to end of life-integrating people, processes, business systems, and information. PLM forms the product information backbone for a company and its extended enterprise.
    • By implementing this methodology, the speed of R&D and manufacturing process of the firm is increased thus increasing the productivity rate and the efficiency of the firm.
  3. Maintain Quality and good customer relationship

  4. Affordable cost for services provided

  5. Implementing Lean technology and Six-Sigma

By implementing lean technology and 6 sigma in our firm, We have given more power to the employees and thus improving their mentality and productivity. By this implementation, the overall productivity increases, reducing non value added process and increasing value added process.

The main principles of concern for this project are as follows:

Total Quality Management (TQM): An approach for a customer-focused organization that involves all employees in continual improvement, include business improvement, quality improvement and overall customer satisfaction.

Concurrent Engineering (CE) with PLM: It is a way of doing tasks simultaneously . A method of designing and developing products, in a time effective manner .It decreases product development time and also the time to market, leading to improved productivity and reduced costs. Basically it is a parallelization of tasks.

3. Main Body of the Project

Study of CE/PLM Lecture and software demo videos

GIBBS CAM

1. What benefits of CAM Analysis can aid the design process of an automaker?

CAM helps design teams create computer models which it can use to simulate various tests. It gives the design team to try various scenarios and see how the parts interact. Some of the tests include mechanical tests, performance tests, and crash clearance tests.

2. How does CAM contribute to a greener product?

The use of CAM allows companies to test different vehicle in many different ways.   It’s testing capabilities leads to reduced development costs, increased employee productivity, and minimizes warranty costs by improving quality in the car. Furthermore it allows the team to instill better quality in the product and analyze the product in different ways which result in a better overall design compared with conventional CAD based designing, clay prototyping, and real world testing.  This allows the company to better utilize its resources.

3. What other process can CAM help with in product development?

CAM can be utilized by more than just the design team early in the product life cycle. This information can be easily passed along since it is electronic. It can be passed to the shop floor to verify manufacturing or design issues. It can be used the quality group to review customer complaints.

4. How important is it to create both the virtual and real prototypes to in CE based product development?

CAM a leads to a very good all around virtual prototype but designers still use the clay based prototypes for cars. There are many aesthetics related issues which might not be easily seen in CAM and it serves as way to generally verify the CAM model.

5. How does CAM help with concurrent engineering practices?

There are many different ways the tools of CAM can be used in various parts of the product life cycle. It can be argued that almost all of the processed involved with the PLM. One of the more important contributions is that it serves as a communication tool and a medium which the details of the car can be passed to the various groups. For example design engineers can send the CAM to the manufacturing engineers to verify that it will be possible to assemble a certain part. This can be quickly loaded by the manufacturing engineer and verified.

Land Rover Discovery P1 ViPodLx

1. What does four channel IBS system mean?

IBS system sensess four wheels individually and control four wheels effectively. At each wheel there is a speed sensor which control the functionality of the system.

2. What is traction control system?

When is vehicle is passing through difficult terrain such as ice, snow or muddy field, it has each wheel control system which can monitor the slip of each wheel based on IBS software.
If one-wheel loss the control, the traction system can even intervene at zero throttle.

3. What is Central differential system?

The transfer box attached to central differential system say in some circumstances the front wheel loss traction while climbing the steep hill and start spin and the system automatically detects and locks the front wheel and transfer torque to rear wheel.

4. What is the additional feature that controls slip?

Each wheel has toothed ring that counts rotation and information feed to ECU mounted in engine and then valve plug close to engine issues demands to integrate pump which generate pressure that applies brakes.

5. How does Discovery provide different braking pressure to the front and rear brakes?

Usually the rear brakes require lower pressure than the front brakes. This is usually achieved by mechanical valve sometimes with a linkage to the suspension system to monitor the load. In Discovery, with the IBS system developed, the mechanical valve is substituted by software alone.

 Land Rover Discovery P2 ViPodLx

1. What is the active cornering enhancement?

It’s a system land rover developed for sports utility vehicles. Because the SUVs have a higher clearance, they tend to lean to one side as they negotiate a corner. this experience is uncomfortable for the passengers because unlike the driver, they have nothing to hold onto.

2. How does ACE (active cornering enhancement) system work?

This system requires a hydraulic pump which is controlled by the on-board controller. A piston pump which is engine driven, supplies pressure which is required to activate the system. This pump is connected to the valve block. The valve block directs the hydraulic pressure to the required parts of the vehicle and regulates the pressure.

3. How do the valves function?

There are two valves on the valve blocks which are connected to the electronic controls. These valves are activated depending on whether the vehicle is going left or right.

4. What’s the function of the pressure control valve?

It receives the signal from electronic signal unit and with that signal it generates the required pressure which corrects the body roll. That pressure is fed to the actuators.

5. What is an anti-roll bar?

It consists of a mechanical linkage.  Its one arm is connected directly to the axle, which slips freely. Pressure can be supplied to either side of actuator’s pistons and it is connected to one end of the anti roll bar via a short lever. Depending on which piston is under the pressure, it provides an equal and opposite pressure to the axle. This action produces a restoring torque which is equivalent to the body roll

Marc Bauman Interview

1. What has Sam’s tours aspired to achieve in the last two decades?

They have tried not only to become  a dive company but an eco adventure company as well. Everyday throughout the year, they’ve tried hard to incorporate sustainable practices both in their diving operations, kayak operations, retail, restaurants and everything else they do.

2. What are the challenges faced in creating a sustainable eco friendly place and marketing that?

The foremost challenge is living on a remote island in the middle of pacific. This makes getting things and products available a challenge, it has to be planned beforehand. To deal with this, many things are reused to that there’s not a lot of trash on the island and things are available. For example reusing lunch boxes and water bottles instead of cups.

3. How does the operation deal with the production of electric power on Palao?

Power generation is a big challenge. The work is ongoing in integrating the solar power with the grid. Australian market has funded several green and environmentally friendly projects such as solar heater for hot waters etc.

4. Does Palao face any issues with technological development?

Since it’s situated in the middle of the pacific, it doesn’t experience a technology invention or revolution everyday. Also, it’s difficult to get a handyman to fix any issues with the gadgets or something as simple as a street light.

5. How do they deal with the local legislation and implementation of technology?

Palao has some of the toughest shark and fishing rules in the world. They’ve managed to protect their resources in a way most other Island nations have failed. Sam’s tours have begun implementing technology by training the local population in sustainable practices. Because the native population has always lived in more traditional ways so sometimes there’s a little resistance. But they are slowly beginning to embrace it.

Kistler engine sensors

1. What are the pressure sensors used for in a diesel engine?

Pressure sensors are used in piston and combustion chamber. They measure the combustion pressure when the piston begins the combustion by mixing the fuel with air.

2.   What’s the function of water  cool sensor?

Depending on the data provided by the pressure sensors, in order to maintain a uniform combustion temperature, water cool sensor is used to provide maximum efficiency by maintaining a uniform temperature level.

3.  How are the sensors calibrated?

Sensors are calibrated in a simulated environment. The combustion temperature reaches 2,500 degree  kelvin so the water cooled sensor is placed to provide maximum efficiency.  Water cool sensor is very precise and bulky so its important to place it with precision inside the engine.

4. How is the air getting into the cylinder determined?

It is important to know how much air is getting into the cylinders to determine how much air is available for the combustion. The sensors keep track of the air pressure at the intake manifold. They measure the pressure inside the intake manifold.

5.  What’s the purpose of a sensor in an exhaust manifold?

The sensor in the exhaust manifold determines the airflow out of the engine. Due to high temperatures, the sensor is cooled by using a cooling and switching adapter.

I-BEAM ROLLER QUALITY

1. What are the compromises associated with lowering the cost of a product?

When one focuses on lowering the price of a product, the quality usually suffers. The company spends less time checking fewer units as it rushes to produce as massively as possible. Also, less money is pent on quality control. So products that leave the facility may not even be good for the well-being of a customer.

2. Why parts don’t function?

Parts of a machine don’t work because the manufacturer did not check the product before it left the facility. They may also fail because the process used to build the products is very manual. Manual production will mean that there will be great variability in the output and some products will work while others fail.

3. Why do companies export the manufacturing of their products?

Companies export the manufacturing of their products because of the huge cost savings. If a company can save money on their operational costs, they can pass that savings onto their customers. Because customers will buy their more cost effective product, the company will be leading in the market.

4. What are the cost to the manufacturer for low-cost products?

Since quality has been reduced in the production of the product, the manufacturer will lose credibility. His products will be known as very low costing goods, but also low quality goods. His reputation will be tarnished by his lousy products and it will be hard to build a more positive report with customers later on even if the quality of his products improve.

5. What customer service measures that the I-Beam roller company take?

There are almost no steps taken by this company to ensure the satisfaction of its customers. Dr.Ranky explained that the only thing to do is return the product to the manufacturer, which is a lengthily process that is not even worth the effort. Otherwise, there is nothing done by the company to ensure customer satisfaction.

Hexel Fanuk Okuma and Makino

1.What type of products does Hexel manufacture?

It manufactures five axis milling table.

2. How does the setup of machine work?

It adjusts y axis on table in the diagonal fashion, when we put the parts on the table touching on the edge finder and machine configure itself rather than putting parts towards machine.
Virtually reduces setup time and error.

3. What are the repeatability and accuracy value? Describe its movement?

Its repeatability is 5 to 10 microns and accuracy of 25 microns and capacity of 200 pounds.
The leg can adjust accordingly without movement depending on the requirement.

4. How does the machine program?

It doesn’t need program, basically it runs on GNM and robotic code and can adjust to any kind machine language.

5. How does troubleshooting work?

 The modem comes with makino which can control error remotely and It can diagnose on screen itself and has four error reporting features. The cell system is unmanning which can operate by itself once loaded.

6. How does the dynamic scheduling system works?

The production order is set on priority basis have controller software’s and provides tool management also and thus improves efficiency.

Dynasim-EngmodelSim-ViPodLx

1. What is the main work profile of dynamism?

Dynamism design multi-engg modelling simulation software tool for automobiles. That can be used to simulate the dynamics of a full system such as a vehicle and based on the software we can create models that are from different engineering domains.

2. Which language does it use and its advantages?

The model is based on modelica language and its advantages are that it can be possible to control multiple systems at a time specially for automobiles i.e. mechanical, electrical, thermodynamics, powertrain, hydraulics, gearbox, pneumatics, wheel suspension and engine.

3. What is the best feature of this model?

It is an open model in which we can change composition and it will adapt to unique needs. It is equation based and we can change equation based on unique needs and very suitable if we want new designs.

4. How does it work?

It has predefined set of library through which it interprets i.e.
i) User models
ii) Modelica libraries
iii) Model parameters
All these are handled by symbolic kernel and then goes to experimentation section then plot and animation and finally reporting. Calibration are based on real engineering equations. It is possible to connect that model with other languages like matlab, Simulink.

5. Why modelica is considered as standard modelling tool?

It’s multifunctioning and dynamic simulation based on fundamental engineering equations can work in coordination with other languages also. That’s it is a benchmark for clients like BMW, Audi, Daimler Chrysler and Volkswagen.

MINI Assy VipodLx

1. What are some areas of waste in the MINI Assembly process?

The MINI assembly process that rely on human accuracy for quality. The manual aspects of the system takes longer time which slows production time. As seen in the video during the gasket and wire installation. If something is attached incorrectly that leads to improper seals it can create rework also leading to waste.

2. How does MINI incorporate quality in its manufacturing process?

MINI implements a few different techniques in the video to establish control on quality such as the power wrenches which keep track of the vehicle and how well each bolt was fastened. This data is tracked through the production process and stored. This data can also be used later for quality purposes or other reasons such as by the design team. For example, if there is a  improper fastening then the design team may want to move or adjust the location of where the bolt is fastened.

3. What are some green aspects of the mini manufacturing process?

During the assembly process there is no halt time. The process is continuous and the car moves along the line at specific rates with tasks assigned either by individuals on the line or automated robots. This ensures no hang ups and takes full advantage of the capabilities of the resources put into manufacturing the car.  Also the line is flexible in that it can produce different models of the vehicle not requiring separate lines.

4. What are some aspects of the MINI that show design for manufacturability?

The steps for producing the car are well thought out. In the video you can see the car is moving down the line with the outer frame painted and put together but the windshield is not installed. This allows the sunroof assist machine to enter through the front of the car and install it with proper clearance. This example shows that the MINI engineers have designed the car such that every component can be assembled with proper clearance and order of assembly set up such that it does not disturb anything already installed.

5. What are some ways the manufacturing process of the MINI can be improved?

It seems that the line could be more automated and have more controls to make it more flexible than it already is.  Gasket application and wire installation can easily be performed by robots. In addition, the roof cardboard installation can also be done through the use of robots. This would help with quality because it can ensure it is performed the same way every time. Also the line can have more controls so it can sense which car is coming on the line and automatically install the sunroof without operator intervention.

Mini Body

1. How can using robots implement all the welding results in the highest quality of car?

The manufacturer or producer can ensure the higher level of accuracy by allowing robots to perform the welding. As we see in the system, the weld are the foundation of the vehicle and with using robots, the human error will be removed from this part of the manufacturing process. This will help to reduce the costs and enhance the quality of the car.

2. How the use of laser cameras can increase the quality of manufacturing process?

By using these laser cameras we can make sure that the geometry of the assembled car is absolutely correct and the final operation does not have defects which shows us the high level of quality in final product. These laser cameras also can be helpful for inspection of the vehicle to find the problems in the manufacturing process and correct them as soon as possible.

3. How does the ability of quickly replacing robotic parts can increase productivity?

The weld arms used on the robots are stored next to the production line. These parts can be easily removed and replaced by the expert engineers and come back to the line within less than half an hour. This will reduce the time of the production and allows the broken arm to be fixed offline.

4. What is the concept of working in groups?

It means to improve the quality workers and managers work together as a team. The workers have the opportunity to make changes if required. This concept will value worker’s input to improve the processes involved in manufacturing.

5. What are some areas of waste in the Mini assembly process?

The Mini assembly process has many manual aspects that rely on human accuracy for quality. The manual aspect of the system requires the line to move slower which reduce the production time. The most important factor in this assembly process is that if something attached incorrectly leading to rattles or improper seals can create rework also leading to waste.

Answers to the questions based on 3D eBook in the eLearning kit

1. What are CE and PLM?

Concurrent Engineering (CE) is a work methodology based on the parallelization of tasks. Concurrent engineering concept states that the preceding design activities should be occurring at the same time, or concurrently. Hence the concurrent nature of these processes significantly increases productivity and product quality and reduces the number of costly product design changes.

Product life-cycle management (PLM) is the process of managing the entire life-cycle of a product from its conception, through design and manufacture, to service and disposal. PLM is a strategic business approach that applies a consistent set of business solutions in support of the collaborative creation, management, dissemination, and use of product definition information across the extended enterprise, and spanning from product concept to end of life-integrating people, processes, business systems, and information.

2. What is the difference between CE and PLM?

Concurrent Engineering is methodology used in product development. On the other hand, Product Life cycle Management is focused more on entire project life cycle from idea to product delivery. The goal of CE is to reduce time needed to bring the product to the market. It concentrates on product design integration processes. Idea standing behind CE is to find mistakes and issues early enough, so product initial budget is not going to be increased due to errors whereas PLM is more management oriented which deals with the product’s development.

3. What is green sustainable PLM?

The goal of Green sustainable PLM is minimizing product’s impact on the environment during its life cycle. Also, green sustainable PLM improves product quality while decreasing cost.

4. What is digital design & manufacture and why is this such a huge opportunity?

Digital design and manufacture focuses on implementation of digital tools like CAD, CAM, CAE, PDM or ERP into design process and manufacturing processes. Digital design allows to design sophisticated products and testing various elements in virtual environment without building prototypes and fixtures. It decreases cost of manufacturing, and helps to find many issues during early stages of design. Digital manufacturing is a very important component of PLM, and it allows to test and improve processes. Also, it helps with collaboration. It is a huge opportunity because it greatly improves lead times and decrease cost. Expansive prototypes and testing methods can be avoided when digital design and manufacturing is used.

5. How is digital design integrated with digital manufacturing in PLM?

Digital design is integrated with digital manufacturing in PLM because a product starts with the design phase before manufacturing process. It provides solutions that support effective collaborative manufacturing process planning between designs and manufacturing disciplines. It allows the information that was learned during the digital design stage to be transferred and used by digital manufacturing step of the project.

6. What is frontloading and why is it critical to understand this process?

Frontloading is the process that all of the information about the product is preloaded into the system. This information includes drawings, tooling and parametrically controlled models is created before the product is well defined. It helps the company to visualize the actual manufacturing or assembly process in the designing stage. Therefore, they are able to reduce the cost by making design changes early in the process. In this step, design engineers can control for feasibility of how actual assembly is going to check out. It will reduce the number of changes and errors in the future of the process and also reducing the time and this is the reason why it is critical and important to understand the process.

Questions and Answers from Ch 1, 2 & 3.

Chapter 1

1. What is the difference between traditional approach and TQM approach?

Total quality management has changed the traditional management style forever. It was a very radical movement those days. Some of these changes are radical even today. Few of these changes are discussed below.

  • Traditional approach focused on internal activities. Products or services provided by organization were assumed to be good in quality, if this organization has done its best in producing that product or service. But in TQM, the ultimate decider of the quality is the customer.
  • Traditionally people thought bad quality products are due to the workers who do not perform their job correctly. One of the major differences between TQM and traditional style is the assignment of the responsibility of the quality to the management.
  • TQM is an organization wide movement. All the organization has to be in unity to apply TQM principles. TQM, unlike traditional management calls for high amount of team working.
  • TQM believes in quality assurance rather than checking. Quality is inbuilt to the system, so that products are assured to be in good quality.
  • Unlike in traditional management style, in TQM decision making is based on facts and figures. Therefore, problems are identified correctly, and solutions are well planned.
  • TQM depends on cyclic thinking and is continuous. Therefore, improvements are small, stable and continuous in nature. This is also known as Kaizen.

2. How can we reduce the product lifecycle cost using green CE / TQM approach?

We understand that product is designed initially by understanding the customer requirements, then using CAM/CAM software to design the product, and finally manufacture on the machines. Here we usually generate a lot of waste. Waste are either caused due to bad quality products, leading to rework or dispose, or not having a green CE focus. If we start applying TQM principles in our manufacturing systems, and instead of generating waste, if we start to recycle those scraps, then we can reduce the produce life cycle cost greatly. Also we can reduce the environmental effect that are caused from such activities and work towards the conservation of environment.

3. What is TQM and what are its prime focus?

Total quality management (TQM) is an integrated a set of management practices designed to improve quality at every level. It is set to ensure the organization consistently meets or exceeds customer requirements. TQM places strong focus on:

  • Produce quality work the first time
  • Focus on the customer
  • Have a strategic approach to improvement
  • Improve continuously
  • Encourage mutual respect and teamwork

4. Why is green sustainable CE/ PLM important?

Recently, due to overuse of resources and improper waste disposals, there have been adverse effects on the environment. Excess emission of co2 gas is also leading to global warming which ultimately lead to adverse effects on us. Hence sustainability is increasingly becoming a corporate and social responsibility of every manufacturer around the worldwide. The increasing political and social demand for a more sustainable society, coupled with emerging global legislation is affecting the way in which products need to be designed, manufactured, used and also disposed of.
This calls for sustainability to be created as an end-to-end continuous improvement program and monitor the entire enterprise planning, product development process and end-of-life. The value from the green CE and PLM system will come in terms of bringing discipline in the greener global product design, greener manufacturing processes & proper waste disposal.

5. What are rules for brainstorming designing products in CE company?

Brainstorming allows members of a group come up with different ideas. The following rules should be followed to make it as much effective as possible.
1. Objective has to be clarified and task identified.
2. Task should be sorted in logical order and time should be estimated to finish each task.
3. At the end resources should be allocated and entire plan reviewed.

Chapter 2

1. What are the eight quality management principles on which international and the US standards are based and why they are important?

Customer focus, leadership, involvement of people, process approach, systems approach to management, continual improvement, factual approach to decision making and mutually beneficial supplier relationship are the eight quality management principles. They are important to meet because they ensure that quality is kept through entire process, waste is eliminated and products satisfy customers.

2. Why do small and medium sized companies implement the U.S. Quality Standards (QS-9000)?

Small and medium sized companies which provide services to big companies implement QS9000 standards because they need to assure that the services provided by them meets all the quality standards.

3.Why customer focus is a very important TQM principle?

Customer focus is important for any company to create a good and innovative product and complex knowledge of customer needs is required. Customer focus increases loyalty among customers and helps to grow the business.

4. What are the most important elements of Process Approach Principle?

One of the most important elements in process approach is to lower cost and shorter cycle times which can be achieved by good control of resources. All activities should defined systematically, so the goals can be obtained. Another important element in process approach is to focus on resources, methods and material which helps to improve organizations.

5. Why continual improvement is critical to successful business?

Continual improvement is one of the most important principles. It allows companies to stay ahead of competition, lower cost of operation and improve designs of the products. Companies which are not constantly improving, they lose they edge and quickly can have financial and operational problems.

Chapter 3

1.   What are the benefits of designing for a minimum number of parts?

If we create fewer parts, the cost of the product will be reduced. This is accomplished because fewer parts need to be in inventory and fewer parts are being manufactured. It is also easier to assemble or install products with fewer parts. Also with reducing requirements for maintenance and testing the cost will be reduced.

2. What is the goal of DFM?

DFM means Design For Manufacturing, which is a systematic approach to analyze each individual part and assembly and reduce waste. Any organization can use DFM to reduce the number of stages and setups required until the product is made. With using DFM, organizations can reduce their lead times, tooling and setup expenses. By analyzing each step in the manufacture of the product, the utilization of DFM will reduce the waste and save time and money in the overall assembly.

3. What do the terms MUDA, MURA and MURI refer to?

They are used in reference to KAISEN which is a Japanese technique referring to gradual product design and process improvement. MUDA is a type of problem that refers to waste from material, time, poor planning and poor manning. MURA is another type of problem that refers to irregularities, differences and variability’s caused by men. MURI also is another type of problem that refers to strain and stress that can be cause by poor work conditions or disharmony among the workers.

4. What are sustainable green design trends?

The trends in product designs are to eliminate waste and optimize processes. The important methodology used is Lean Six-sigma. The other important trend is to meet present needs without compromising the ability of future generation to meet their needs.

5. Who is Dr. W. Edward Deming?

Dr. W. Edward Deming is one of the “grandfathers of quality”. He was the person who implemented statistical methods in Japanese industry. He introduced the concept that higher quality means lower cost which was unknown idea to many managers. Managers before that believed that higher quality increases the cost.

4. Social Networking Articles

Would-Be Toyota Prius Prime Buyers Reporting Problems With Ordering & Dealers

This article brings out the misunderstandings between Toyota and its dealers across the US. Due to miscommunication, the dealers assumed that the 2017 prius prime wont be sold anywhere except for California and New York. They even informed the customers walking in that they shouldn’t expect prius prime models anytime soon. What’s interesting is that the company has already planned to ship some cars to the dealers in those areas. In my opinion, the company should’ve put out a notification with clear timetable of its plans. Because of this fallacy, people would be confused if the cars are really coming and this confusion may waver their decision of  buying that car model.

Click here for the reference article.

Click here for the discussion.

Details On New Tesla Supercharger Usage Fees

Tesla has come up with the way of charging those customers without supercharging access. Till now the unlimited free supercharger access is available to new model S and model X vehicles. Every Tesla customer would have access to free 400 kilowatt-hours annually. This won’t be carried over to the next year however and each customer will be credited with it on the anniversary of their delivery. Customers will be charged when they use more than 400 kWh. The exact charges would vary by state and country. In north America, the users would be charged per kWh and in some countries they would be charged per minute owing to the local rules and regulations. Supercharging is poised to be simple, seamless and cheaper than the gasoline. Tesla desires it to be a fair system and not derive profits from it.

Click here for the reference article.

Click here for the discussion.

New York Bets On Renewables To Replace Indian Point Nuclear Plant

Indian point nuclear power plant which supplies electricity to the New York City is poised to close down, as announced by the New York governor. Environmentalists are divided on this decision. With some embracing it, while others lamenting the loss of a carbon-free source of power. Across the U.S. cheap natural gas is proving to be an economical alternative to the nuclear energy.

In contrast, New York is betting on alternative clean energy to fill the gap. It plans to cut carbon emissions by 30% by 2030. It aims to generate 50% power by 2030. New York has begun working on remaking its power grid to integrate renewable energy. Power lines are being constructed to supply NYC with wind and hydroelectric power. The reason to shut down the nuclear plants had been taken after reviewing the fact that Indian Point nuclear plan is just 40 miles from midtown Manhattan. And because of its proximity, it provides a parget for terrorists meaning to do harm resulting in a nuclear meltdown and radiation leakage.

Click here for the reference article.

Click here for the discussion.

5. Summary

The concepts covered in the 3D eBook and Videos include Product Lifecycle Management, Concurrent Engineering, Computer Aided Design, and Computer Aided Manufacturing. They also covered areas of Total Quality Management and quality practices that can be applied to the operation of any organization improve on its efficiently and the quality of their products.

6. Further work needed/proposed

Now that a thorough understanding of the CE and PLM methods have been achieved, these concepts must be incorporated into S2S.Inc to make the company green, sustainable and eco-friendly.

7. References

  1. eBook for IE655 – Concurrent Engineering
  2. Videos from the eLearning pack
  3. http://www.cimwareukandusa.com/All_IE655/IE655Spring2017.html


Assignment 0

My PLM/Digital design and manufacturing challenge, my collaborative companies and my plans for collaborating with them in order to develop, innovate and bring to the market my new sustainable green product/process design”

11807390_10207759556691140_6247408770018560697_oName: Dhananjay Mahesh Bhati

eLearning Pack ID: IE655-Spring2017-18-18

My Virtual company name: Harit Disposal Solutions LTD.

Collaborating Companies

SMTCL

Shenyang Machine Tool Co. LTD. (SMTCL) is the world’s largest machine tool builder. It was founded in 1995. In 2004, SMTCL purchased SCHIESS of Germany, which was a heavy duty machine builder with  150 machine building experience. This acquisition provided SMTCL with Design Centres and Manufacturing Campuses across China and Germany.

SMTCL makes Milling, Boring, Turning, and Drilling machines for a variety of industries including Automotive, Aerospace, Defence, Medical, Energy, Construction, and Consumer Goods. It produces 80,000 machines per year and has 18,000 employees.

KENNAMETAL

KENNAMETAL was founded in 1938. Kennametal delivers productivity to customers seeking peak performance in demanding environments by providing innovative custom and standard wear-resistant solutions. Their portfolio of well-respected brand names and broad global presence enable them to help customers of all sizes in virtually every geography, drive success at every stage of their value chain. Kennametal’s products and services are strategically aligned across two core businesses – Industrial and Infrastructure – due to which they touch almost every manufacturing process.

The company is headquartered in Pittsburgh, Pennsylvania, USA. They have more than 12,000 employees across 60 countries. Kennametal is a  global market leader in tooling for the mining and highway construction industries

Niagara Cutter

Niagara Cutter, LLC is a leader in cutting tool technology. A wholly owned subsidiary of Seco Tools, LLC, Niagara Cutter has provided high-performance, high-value solid tooling to the aircraft, power generation and general metalworking industries since 1954. Made to accommodate all types of workpiece materials and cutting parameters, the company’s vast product selection comprises solid-carbide, high-speed steel and diamond-coated end mills as well as solid carbide multi-purpose thread milling solutions.

Main services and technologies provided by Niagara Cutter are:

  • Application and Design Technology related to Milling
  • Machining, Heat Treat and Grinding Technology used to Manufacture Cutting Tools
  • Cleaning and Tool Preparation Technology related to Cutting Tools
  • Vacuum Technology in PVD Thin Film Coatings related to Cutting Tools

MITSUBISHI Materials

The roots of MITSUBISHI Materials lie in a parent mining company called Tsukumo Shokai, which was a coal and mineral mining company. It was in 1990 that Mitsubishi Metal and Mitsubishi Mining & Cement merged to form Mitsubishi Materials Corporation. The company has around 30,000 employees and has a net annual sales of USD 12.32 billion.

The Advanced Materials & Tools Business conducts its business in two primary categories – Cemented Carbide products and sintered parts.
The Cemented Carbide products department provides an extensive array of cutting tools used in processes including lathe turning, milling, and drilling, as well as abrasion-resistant tools and construction tools. The department manufactures these products in Japan and overseas, sells them in global markets, and has a leading share of the Japanese market.
They also undertake the recycling of tungsten, a rare metal, and focusing on the recovery of used cemented carbide tools.
In the sintered parts department, the company produces sintered parts for automobile engines and transmissions at five locations around the world, helping to meet the growing need to increase fuel efficiency for eco-cars and other vehicles and shift toward the use of electric cars.

Cutting is a Metal-working operation wherein a metal is formed into a specific shape by chipping or cutting away excess metal using different tools and lathe machines. This operation yields two results – a finished product that meets the requirements and huge amounts of waste or excess metal that was removed. The waste generated is called chips or swarf; which are basically long, stringy tendrils or shavings. Chips can be extremely sharp, and this creates a disposal problem, as they can cause serious injuries if not handled correctly. Depending on the composition of the material, it can persist in the environment for a long time before degrading. This, combined with the small size of some chips (e.g. those of brass or bronze), allows them to disperse widely by piggy-backing on soft materials and also to penetrate the skin as deep splinters.

Drilling and milling operations also use oxy-fuel cutting torch and etching and masking chemicals. Milling can produce extreme heat due to intense friction. To prevent the heat from spreading and destroying the work-piece, a coolant is used which decreases the friction and temperature and prevents excessive tool wear.

About my company

Harit Disposal Solutions LTD.

My company aims to bring about Smart and efficient Waste Management solutions to the Metalworking industry. The above mentioned companies are pioneers in the metal cutting industry and their products and services consist of Milling, turning, filing, etc.

My company would collaborate with these companies to process the waste generated. The chips and bundles of excess metal can’t be sent to the landfills because they are contaminated by coolants and oils. In landfills, these liquids may seep into nearby soil and destroy the fertility of the ground. These waste materials would be processed in a centrifuge to separate liquid from the waste metal. The liquid can be further processed so that it’s no longer toxic. The metal bundles and chips would be recycled. This recycled metal can be further manufactured to form other products. This recycling would reduce the amount of mining and refining done every day to meet the ever increasing global demand for metal.

We also aspire to come up with newer ideas and technologies in Metalworking industry to reduce the amount of waste produced per job.

Budget

The proposed operation would require extensive resources and funding. The yearly budget stands around USD 10 billion.

capture

Tracked  metrics with a CE/PLM and green focus

capture1

Management by Objectives with a CE/PLM and green focus

  1. Eco-friendly: Our services would help eliminate the toxicity of the waste chemicals and coolant liquids. Also, the metal waste won’t have to be dumped in landfills, where it would be hazardous to anyone since the fillings and chips are sharp and small.
  2. Trustworthy partnership: Our partnership with the suppliers would be based on a mutual trust and respect.
  3. Research and Development: Additional funding and brain-power would be redirected to research and development department to improve the efficiency of the operation. An efficient operation would drastically reduce the capital spent on recycling and coolant separation and processing.

Key processes with a sustainable green PLM/CE focus

  1. Centrifugation: Centrifugation is used to separate the coolant liquid and oil which has contaminated the metal waste. The principle of this operation is that denser particles move towards the periphery and lighter materials migrate towards the axis.
  2. Research and Development: Our company has well established research facilities which continuously work on improving the efficiency of the operation and bringing down the cost and energy expended.
  3. Quality Assurance: Harit Disposal Solutions LTD strives to make the planet cleaner and greener. A federal or state pollution regulator would have full access to the facilities and their suggestions would be taken into account. This will keep the air, ground and water pollution to a minimum.
  4. Marketing: Marketing department would be responsible for advertising our services and accomplishments thereby earning us clients and valuable goodwill of the public.

Sustainable Green focus

Harit Disposal Solutions LTD. strives to make the environment cleaner and sustainable. The company takes numerous steps to process harmful chemicals and coolant liquids and recycle waste metal, which would in turn reduce the amount of metal mined around the planet. The below links to maritime videos by Mr. Paul G. Ranky bolsters our inspiration and drives us to exceed our responsibility to the environment. Since the chemicals would be processed to eliminate their toxicity, they will cease to be a threat to the marine life.

Link to the Presentation

Maritime video 1

Maritime video 2

Maritime video 3

Maritime video 4

Maritime video 5

Social Networking Articles

Global Clean Energy Investment Is Down, But Solar Is Cheaper & Offshore Wind Is Booming

As per the research conducted by Bloomberg New Energy Finance, global investment in clean energy fell by 18% last year – leaving it far behind the goals stated in the Paris Agreement.

This reduction in investment is partly because Solar energy got a lot cheaper than what it used to be. Therefore, despite reduction in investment, a record of 70 MW of solar capacity was installed around the world. Some nations have begun showing interest in harnessing the power of off-shore winds, such as China, U.S. and Taiwan.

China has pulled back its investment because the clean energy it produced is bottled up. To spread the energy produced, China is building a national power grid to connect rural areas all over the mainland. So, this slowdown in investment is most likely temporary.

Increased concern about global warming and lower clean energy prices will soon give a boost to the investments in near future.

Link to the reference article

Link to the detailed discussion

P&G vows to eliminate all manufacturing waste within four years

Procter & Gamble Co have committed to bring down all manufacturing waste from more than 100 plants to zero by 2020. The company is planning an investment to recycle or re-use about 650,000 metric tons of waste that at the present goes to landfills. About 56% of its plants have already achieved the goal of zero waste to landfills.

P&G strives to achieve its goal by ensuring that all incoming materials be either converted to finished products, recycled or re-used in some way. As an example, liquid waste from its plant in Ohio is converted to alternative fuel for vehicles. Non-recyclable plastics from plants in India are shredded and pressed into building panels.

Link to the reference article

Link to the detailed discussion

Wind and Solar Growth Outpace Gas

Per a new survey by U.S. Energy Information Administration, more than half of 24,000 MW of electricity generation capacity added comes from renewable resources. Almost 60% of capacity added came from wind and solar resources and about 3% from hydropower, biomass, landfill gas, etc.

EIA noted that increased capacity doesn’t necessarily assure large share in renewable power generation because the renewable resources like wind and solar are intermittent and not periodic. EIA reported that most renewable generation comes from Western states, which accounted for 63 percent of all U.S. hydroelectric power and 77 percent of all solar generation in 2016. Roughly 72 percent of the nation’s wind power came from the Midwest and the South, notably Texas, while 24 percent came from Western states.

In 2016, natural gas power generation surpassed coal fired generation owing to 17% fall in coal production. Natural gas power generation accounted for 34% of total generation compared to coal’s share of 30%.

Link to the reference article

Link to the detailed discussion.

Assignment 6

1. Explain why continual quality improvement is important?

The reason why continual quality improvement is important is that it is fundamental to success in the global marketplace. The concept applies to processes and the people who operate them as well as to the products resulting from the processes. And all three- processes, people, and products – must be continually improved. That is why it is so important. A company that is just maintaining the status to quo in such key areas as  new product development, adoption of  new technologies, and process performance is like a runner who is standing still in a race. Athletes who don’t improve continually are not likely to remain long in the winner’s circle. The same is true of companies that must compete globally. Customer needs are no t static; they change continually. A special product feature that is considered innovative today will be considered just routine tomorrow. The only way a company can hope to compete in the modern marketplace is to improve continually.

2. What is management’s role in continual quality improvement ?

Managers are leaders, and must lead in “total quality”. The managers would have to establish a Quality Control department, and to work with the department closely. Corporate Quality policies with continuous improvement goals must be established and followed. Managers must be supportive of the department with resources, such as measurement instruments, educational materials, office supplies, capital, and affirmation. Managers must schedule audits, inspections, and giving compliments to encourage good practice.

3. Discuss the Kaizen approach.

Kaizen approach in the name given by the Japanese to the concept of continual incremental improvement which means making changes for the better on a continual, never-ending basis. The improvement aspect of Kaizen refers to people, processes and products.

The underlying value system of Kaizen can be summarized as continual improvement of all things, at all levels, all the time, forever. All of the strategies for achieving this fall under the Kaizen umbrella. Executive managers, middle managers, supervisors, and line employees all play key roles in implementing Kaizen.

If management praises someone for a quality change resulting in improvement in product or service, it will most likely encourage others to be open to change. Some of the areas that management must consider for Kaizen are customer focus, teamwork, quality circles, employee/management relationships, and automation.

4. How would you describe a lean system?

A lean system focuses on doing more with less. It emphasizes adding more effort in conduct activities that add value to a finish product or service, while reducing activities that does not add value to the finish product or service over a long term. It is about being flexible enough to get the rights things, to the right place, at the right time, in the right amounts. At the heart of the concept are the reduction of waste and the improvement of work flow.

5. What is lean six-sigma and how would you apply it to a quality management system?

Six Sigma is a broader concept of Total Quality with a goal to achieve a defect rate of 3.4 per million or less. By attaining this goal will make a company in the service and manufacturing industries more competitive. The Six Sigma here is the full-bodied, potent improvement system and the lean part is the complete and proven Quality Management system found in the Toyota Production System and Just-In-Time. The two complement each other with their strengths, namely Lean’s elimination of waste and Six Sigma’s breakthrough methodology for solving performance problems and making improvements. Through the process of identifying the needs of customers, classifying the needs of customers by rank, and determine the process variation for each customer need, and addressing all critical areas that need improvement, the companies will benefit in the areas of cost reduction, productivity improvement, and cycle time reduction.

6. Define benchmarking. Define Auditing. How does benchmarking and auditing relate to each other?

Benchmarking is the process of comparing companies’ processes against the best of its class in a given industry. It is also the process to determine the secrets of success of any function, in order to close the gap with a company that is the best of its class. Whereas, Auditing is the on-site verification activity, such as inspection or examination, of a process or quality system, to ensure compliance to requirements. An audit can apply to an entire organization or might be specific to a function, process, or production step.

From the definitions, auditing and benchmarking go side by side. While benchmarking ensures that a product or service provided is comparable to the best in class, auditing ensures that this quality of product is maintained across the production line.

7. How can you apply benchmarking data in auditing processes, systems, designs, products, factories and services?

The benchmarking data we collected must be analysed thoroughly in comparison with the data taken from its own process. After the team concludes that there is no doubt that the partner’s process is superior, they should try to answer the following questions:

  • Can its process replace ours?
  • What will it cost?
  • Can we afford it?
  • What impact will it have on adjacent processes?
  • Can we support it?

 The quantitative information is effectively the “stake driven into the ground” as the point from which future progress is measured. Qualitative information covers such matters as personnel, policies, training, management styles and hierarchy, total quality maturity and so on.

The quantitative data are clearly the information sought and are always used. However, there may be more value in the qualitative information. It describes the atmosphere and environment in which best-in-class can be developed and sustained. Do not ignore it. Take it very seriously. Study it, discuss it in staff meetings, and explore the possibilities of introducing these changes into your culture.

8. What is a JIT system?

Just-In-Time (JIT) system is the system making products only when needed from materials that were made available by suppliers only as  required. It is developed from Toyota Production System. JIT manufacturers let their suppliers keep their materials inventory until the manufacturers need it. JIT permits the production of only what is needed, only when it is needed, and only in the quantity needed.

9. What are the benefits of JIT/lean?

There are numerous benefits of the JIT/Lean system enjoyed by companies. The benefits are based on four main areas, which are :

Inventory and Work-In-Process: JIT/Lean attempts to drive inventory to zero. But in real world, zero inventory makes no sense. The real objective is to minimize the inventory to the maximum possible extent without shutting down production. The company-minimizing inventory will reduce cost of production, and continual improvement will become a reality, which results in more savings.

Cycle Time: Production cycle time is defined as the period bounded by the time materials are sent to the manufacturing floor for the making of a product and the time the finished goods are dispatched from the manufacturing floor to a customer or to finished goods storage. When the cycle time is lowered, production cost is lowered.

Continual Improvement: Continual improvement seeks to eliminate waste in all forms, improve quality of products and services, and improve customer responsiveness.

Elimination of Waste: Reducing non-value work towards the end product will result in lower manufacturing cost.

10. Discuss automation system ideas for JIT/lean.

JIT/lean and automation are mutually exclusive. Rather, it is more meaningful to discuss the processes that use humans and manual machines than the same processes powered by robots. If the fundamentals where humans apply are understood, the same fundamentals will be useful in an automated plant. All the same rules apply. We are not anti-automation.
Automation may be advantageous in many applications, but if you have not solved the problems in the human operated versions of those same applications, you are not ready to automate them effectively. If you try, you will automate your problems and will find the robots far less adept at working around them than the humans they replaced.


Social Networking Articles

Morphing membrane improves battery charge times, stops leakage

The researchers at Ohio State University are working on a “smart” membrane, which would result in faster charging batteries capable of holding their charge when not in use. Existing batteries use separators for membranes which conduct the charge while keeping anode and cathode apart. These membranes leak charge, which reduces the battery’s effectiveness over time.

The OSU researchers mimicked the function of human cell membranes which open and close tiny pores in response to electrical stimuli. The result was an electrically conductive polymer that shrinks to open the holes while the battery is in use or charging, and expands to close them when turned off. This could be of most important use in case of electric and hybrid vehicles where in the introduction of redox transistor helps to improve the charge of the vehicle with ten miles per minute of charge. The other plus point of this is that it can be either charged or it can be refilled. This research will lead to development of efficient vehicles in the automobile industry, and also it would help in solving the discharging of the batteries. The cost of these batteries wouldn’t be an issue as it can be recharged more times compared to the existing batteries.

Click here for the reference article.

SpaceX Dragon Heads Back To Earth With Station Science, Gear

SpaceX, a private space transportation company developed a free flying spacecraft designed to deliver both cargo and people to orbiting destinations. This spacecraft, named Dragon headed back to earth in late August, carrying science experiments and gear from the international space station. Astronauts aboard the space station used a big robotic arm to release the capsule 250 miles above Timor Sea north of Australia. Dragon delivered a new docking port last month that will be used in another year or two by SpaceX and Boeing, which are developing crew capsules for NASA.
SpaceX is the only firm capable of returning items for analysis back to earth. Other spaceships in the industry burn up upon re-entry into the atmosphere.

Click here for the reference article.

Click here for the detailed discussion.

Tug Boats Help Refloat Oil Rig That Ran Aground On Scottish Coast

A Transocean Winner oil rig that ran aground on a remote Scottish shore has now been towed off the rocky coast by two tug boats. The small boats towed the 19,000-ton rig “safely off the rocks”. The salvage team took advantage of high water levels, which in part helped in refloating the stranded rigs. Most of the fuel aboard the rig evaporated while it was stranded, while the rest was transferred to a supply vessel. Two of the four tanks were intact, while the other two were breached. The timely action by the crew on-board prevented huge quantity of oil from spilling into the sea.

Click here for the reference article.

Click here for the detailed discussion.

Assignment 5

1.  What is QFD (Quality Function Deployment)?

Quality function deployment is an effective system for collecting customer input and factoring that input into the design process. Building affinity diagrams is an effective method for organizing customer feedback data so that it can be used to make ongoing design improvements. QFD allows for the systematic incorporation of customer needs, production capabilities and capacity, and all other relevant parameters into product development. QFD consists of the following basic activities:

  • Deployment of customer requirements (quality needs)
  • Deployment of measurable quality characteristics
  • Determination of the correlation between quality needs and characteristics
  • Assignment of numerical values to each quality characteristic
  • Integration of quality characteristics into the product
  • Detailed design, production, and quality control of the product

2.  Explain the WHATs in a QFD matrix.

  1. Gathering Customer Needs Input: The premise of QFD is that before any product or service is designed, the producer should have a good understanding of his potential customers’ needs in order to improve the likelihood that the product or service will be a market success. That the producer should be aware of customer needs seems logical, but it sounds far easier than it is. Before the textbook rework is started, the QFD team must work diligently to determine what potential customers would like to see in terms of attributes and features of the product—and perhaps—what they don’t like about our current product.
  2. Refining the Customer Needs Inputs: Once the cross-functional QFD team has assembled sufficient information on what characteristics, attributes and features customers say they need, the information must be distilled into something useful. The data must be sorted into a prioritized set of the most important customer needs. At this point we will call on some QFD Tools, the first of which is the Affinity Diagram. Refining a large collection of data into something that represents the essence of the VOC is done through the analysis techniques of the affinity diagram, and QFD team discussion.


372837_orig
Tree Diagram: WHATs for the HOQ.


3.  Explain the HOWs in a QFD matrix.

The Technical Requirements room of the HOQ states how the company intends to respond to each of the Customer Needs. It is sometimes referred to as the voice of the company. We must state at the outset that the technical requirements are not the design specifications of the product or service. Rather, they are characteristics and features of a product that is perceived as meeting the customer needs. They are measurable in terms of satisfactory achievement. Some may be measured by weight, strength, speed, and so on. Others by a simple yes or no, for example a desired feature, appearance, test, or material is or is not incorporated. The other side of the coin is that the technical requirements must not be limiting, but must be flexible enough to allow the company to consider every creative possibility in its attempts to satisfy the need.

2630502_orig
Technical Requirements (HOWs) applied to the HOQ.


4.  Explain the 1, or 3, or 9 interrelationship values in a QFD matrix.

Now that we have the QFD team’s technical requirements (HOWs) in the HOQ, the next step is to examine how they relate to the WHATs of the Customer Needs. The results will be shown in the Interrelationships matrix, which links the HOWs and the WHATs. At each intersection cell of the interrelationship matrix the team must assess the degree of relationship between the WHAT and the corresponding HOW. This is usually done using scales of significance of 1 to 5 or 1 to 9, with the higher number indicating a stronger relationship. Sometimes these numbers are entered, but often symbols are used.

There are several principles applied in the matrices:

  • In QFD, only about 15% of the interrelationship cells will show a relationship between WHATs and HOWs.
  • Every row and every column must have at least one entry.
  • An empty column means that the HOW is not delivering value to the customer needs.
  • An empty row indicates that the WHAT is not being addressed.
6122896_orig
Interrelationships between WHATs and HOWs.


5.  Explain how you calculate the technical priorities in the design target matrix.

The QFD team simply multiplies each of the interrelationship ratings of the technical requirement (0, 1, 3, or 9) from the Interrelationship matrix, times the corresponding customer need’s Overall Weighting value in the Planning matrix; and then sums the columns. All of the data for these calculations are already in the HOQ.

6.  Define statistical process control.

Statistical process control (SPC) is a statistical method of separating variation resulting from special causes from variation resulting from natural causes in order to eliminate the special causes and to establish and maintain consistency in the process, enabling process improvement.

7.  Explain control charts for variables, with a simple mathematical example.

Just as there must be many different processes, so must there be many types of control charts. It is important, as the first step in developing your control chart, to select the chart type that is appropriate for your data. The specific steps in developing control charts are different for variables data than for attributes data. Consider an example using x -charts and R -charts. These charts are individual, directly related graphs plotting the mean (average) of samples (x) over time and the variation in each sample (R) over time. The basic steps for developing a control chart for data with measured values are these:

  1. Determine sampling procedure. Sample size may depend on the kind of product, production rate, measurement expense, and likely ability to reveal changes in the process. Sample measurements are taken in subgroups of a specific size (n), typically from 3 to 10. Sampling frequency should be often enough that changes in the process are not missed but not so often as to mask slow drifts. If the object is to set up control charts for a new process, the number of subgroups for the initial calculations should be 25 or more. For existing processes that appear stable, that number can be reduced to 10 or so, and sample size (n) can be smaller, say, 3 to 5.
  2. Collect initial data of 100 or so individual data points in k subgroups of n measurements.
  • The process must not be tinkered with during this time—let it run.
  • Don’t use old data—they may be irrelevant to the current process.
  • Take notes on anything that may have significance.
  • Log data on a data sheet designed for control chart use.
  1. Calculate the mean (average) values of the data in each subgroup x.
  2. Calculate the data range for each subgroup (R).
  3. Calculate the average of the subgroup averages x. This is the process average and will be the centerline for the x -chart.
  4. Calculate the average of the subgroup ranges R. This will be the centerline for the R -chart.
  5. Calculate the process upper and lower control limits, UCL and LCL respectively. UCL and LCL represent the ±3σ limits of the process averages and are drawn as dashed lines on the control charts.
  6. Draw the control chart to fit the calculated values.
  7. Plot the data on the chart.

8.  Explain control charts for attributes, with a simple mathematical example.

p-Chart. Attributes data are concerned not with measurement but with something that can be counted. For example, the number of defects is attributes data. Whereas the x – and R -charts are used for certain kinds of variables data, where measurement is involved, the p -chart is used for certain attributes data. Actually, the p -chart is used when the data are the fraction defective of some set of process output. It may also be shown as percentage defective. The points plotted on a p -chart are the fraction (or percentage) of defective pieces found in the sample of n pieces.

Control charts with attributes has been explained with an example  below:

350297_orig

9.  Discuss and explain various continual quality improvement methods and tools.

Control charts of all types are fundamental tools for continual improvement. They provide alerts when special causes are at work in the process, and they prompt investigation and correction. When the initial special causes have been removed and the data stay between the control limits (within ±3σ), work can begin on process improvement. As process improvements are implemented, the control charts will either ratify the improvement or reveal that the anticipated results were not achieved. Whether the anticipated results were achieved is virtually impossible to know unless the process is under control. This is because there are special causes affecting the process; hence, one never knows whether the change made to the process was responsible for any subsequent shift in the data or if it was caused by something else entirely. However, once the process is in statistical control, any change you put into it can be linked directly to any shift in the subsequent data. You find out quickly what works and what doesn’t. Keep the favorable changes, and discard the others.

10.  Explain the way control charts could be used for quality improvements.

Control charts are heart of process control and can be used in many applications. Everything done in the workplace is a process and these processes are affected by a variety of factors. Control charts aid in control of variation, continual improvement, predictability of processes, elimination of waste, and product inspection. All of these elements tie into quality and how to improve it. The charts visually inform its users if a process/product is in control and out of control within a range of accepted values. Once it is determined to be out of control, the process/product is back on the drawing board for improvements.

7340736_orig
Common Control Charts and their applications.


Social Networking Articles

The Evolving Online Community

The reference article buttresses the fact that the internet plays the role of community enabler. It facilitates an easy and smooth interaction between the public and business ventures. According to a study conducted by Mckinsey, 98.7% costumers end up coming back. Innovative companies have endeavoured to leverage interest and action by local and special interest communities by relating to their core beliefs by using promotions, electronic and print advertising and several other means. Using internet, the corporations have taken advantage on promoting their services and products as 10% of online community actively contributes to the content in form of ratings and blogs and others either comment or observe.

Click here for the reference article.

Click here for the detailed discussion.

VW’s Employee Chief Floats Idea Of Taking Stakes In Suppliers

Employee council chief Bernd Osterloh, who sits on Volkswagen’s supervisory board, suggested that the company may need “an extra warning system” to reduce risks. This suggestion comes into light after two of the part suppliers stopped delivering parts briefly. This in turn affected roughly 28,000 workers at six separate plants. This move suggests that the company may need a system in place which would give them an extra warning to reduce the risks.

Click here for the reference article.

Click here for the detailed discussion.

Tiny particles make a big difference in controlling internal bleeding

Scientists at the University of Maryland have are working on injectable nanoparticles capable of speeding up the blood clotting at internal bleeding sites. These nano-particles have a property of bonding with active platelets. Due to this, when injected in a patient, these particles travel to the bleeding site and bond with the blood platelets already at work of sealing off the wound. Tests run on rodents showed a 50% reduction in clotting time. Tests were run on pigs too because their blood is much similar to humans. On doing that, they triggered an immune system response. This was resolved by using neutrally charged nanoparticles dissolved in slippery polymer to prevent the particles from aggregating together. Given these advancements, this technology is expected to arrive for public use within the next 5-10 years. This can greatly reduce the casualties in battles or in an event of a highway accident.

Click here for the reference link.

Click here for the detailed discussion.


Midterm Exam

The quality issues that I have covered include manufactured product issues, software glitches and problems faced in everyday life due to inefficient design if the product.

Case 1

861018_10200870188981253_635234395_o

Problem: The above picture shows an annual blood donation drive at my undergrad college in India. The volunteers had been allotted their respective tasks beforehand. Eight major blood banks had agreed to participate and we expected the donors to cross 1k mark. During the event itself, some junior volunteers tasked with sitting a the front desk and dispatching the incoming donors to beds, left their station and went off to take their pictures and share them online. This led to a massive confusion and people begun leaving when they didn’t know which bed to go to.

Solution: Some volunteers noticed the disturbance at the front desk and promptly took care of the situation by multi-tasking and sharing the extra responsibility. This shows that the person who has been assigned a duty must fulfill it honorably and must strive to handle extra workload for the greater good of an organization. That day we made a South Asia record of collecting the maximum number of  blood units in one day. We had collected 1,171 units of blood in merely 7 hours.

Case 2

img_20161120_090944781

Problem: The picture above shows the air vent in my room. It has two problems. First, it’s situated directly above my bed. So when I sleep in the night, the air flow hits directly on my face, leaving me cold. Now, I’ve thought of changing the position of the bed. But the room is small so, it’s not feasible to arrange the room in any other manner Second, the shutters on the vent are metallic. So when I try closing it, the metallic shutters make a screechy sharp noise. Making it impossible to achieve a peaceful environment.

Prevention: To address the first problem, the designer should’ve provided the vent on a side wall or above the door. That way, the air flow wouldn’t hit you from above. For the second problem, instead of providing metallic shutters, they could be of plastic coated with rubber which wouldn’t make sharp acoustic noise. Alternatively, they could have a rotation mechanism similar to those used in airplanes, which is much more effective.

Case 3

img_20161120_091440754

img_20161120_091449309

Problem: The above pictures are of my dresser. You can see there’s a sharp nail end protruding. It might seem quite innocuous, but it’s quite the opposite when the dresser is placed right next to the study table. In this case, I’ve scratched my feet in a bad way when I was studying and subconsciously moved my feet and they rub against the sharp nail. This can prove to be quite dangerous if this dresser is placed in a household with a young child.

Solution: The manufacturer should apply a padding or insert the nail from outside towards inside, so that it’s not as harmful.

Case 4

img_20161120_091411952

Problem: This picture shows my study table. As you can see, there’s a small rack attached near the bottom. The problem is that this rack is not removable. As a result of this, I’m not able to stretch out my legs under the table and am forced to keep my legs folded under the chair whenever I sit down to do some work.

Solution: the designer probably thought that the rack will provide great utility, and for most parts its correct. But it should’ve been removable, so that if someone wants to stretch and sit comfortably, the rack could’ve been removed and the person would sit comfortably.

Case 5

motog-charger turbo-charger

Problem: These are the pictures of two different cell-phone chargers. In the first case, the (white) wire is extending horizontally. When this charger is plugged into a wall, over time the wire at the joint might be damaged or cut because of its constant downward pull, rendering the charger useless.

Solution: The second picture (black charger) shows the charger from same company but designed for newer phones. This charger is much reliable since it extends vertically down and has a thicker wire. Making it much more durable than the older ones.

Case 6

img_20161120_095455468   img_20161120_095513939

Problem: This picture is of ethernet port of my laptop – lenovo G50. As shown, the port is protected by a cover. Once the cable is inserted, the cover jams it and prevents it from coming out. Making it impossible to take out the cable with bare hands. I use a pen to pry open the cover, this gives a little space to pull free the cable from the laptop.

Solution: I agree that this feature provides protection and prevents any foreign substance from entering. But it’s not designed to be user friendly. The manufacturer could use a sliding cover instead of this retractable one.

Case 7

screenshot_20161119-160733    screenshot_20161119-161520

Problem: This is the screenshot of an article I tried reading on a news daily’s website. The problem with opening the article on a touch-screen phone is that, the interface has numerous advertisement and suggestions for related articles smack in the middle of the article I was reading. Due to this, while scrolling down, my finger inadvertently touches the region where the advertisement is and it opens a new pop up window, thus ruining the whole reading environment.

Solution: I don’t hold anything against the websites hosting advertisements on their pages. But they should do so in a manner that doesn’t hinder the visitor’s website experience. The same advertisement could’ve been placed in a sidebar or at the bottom of the page, thereby making the interface user friendly.

Case 8

Problem: Anyone who’s undertaken a train journey in India has seen that a train compartment is divided into cabins. Each cabin consists of six bunks. Four on one side and two on the other side of the aisle. The railways has provided charging plugs only on the side with four bunks. This poses a problem to people travelling on the other side, especially in long journeys taking more than a day. I myself have faced this problem many a times while travelling longer distances.

Solution: The railways should fix the problem by providing charging outlets on both the sides of the aisle. This will provide all the travelers with ease of charging their electronic devices and they wouldn’t have to cross the aisle time and again.

Case 9

lhb-coaches

Problem: The picture above shows the entrance and exit door of an Indian railways car. As seen, there’s a vertical ladder-stair at the door which the passengers have to use while climbing or getting down at a station. This ladder is a hazard to someone who is in a hurry or to elderly people who have to gather strength to go in or out. Moreover, the ladder is metal which makes it slippery.

Solution: The railways authority should increase the height of the platforms so that the people can easily step in and out without much effort. Bringing the height of platforms to that of the rail car will improve the passenger’s safety and convenience.

Case 10

Problem: For the past month I have been using Hulu. It’s an online streaming service which plays your favorite movies and TV shows right where you are. The problems that I have faced I that the website runs a javascript of its own which interferes with that of your browser. This makes the interface and browser non-responsive for some time and take a minute to run again. This can ruin anyone’s movie experience as it’s quite tedious and irritating.

Solution: To prevent this problem, I’ve used the dedicated applications of these service providers (Netflix, hulu). This way the service’s video decoder doesn’t run counter to that of the browser and the video plays without any hiccups. Alternatively, the service providers should collaborate with the browser designers and figure out a way so that their website is compatible with the browsers.

Case 11

Problem: My primary google ID is based in India. This gives me access to applications and google services specifically launched in Indian subcontinent. Upon arriving in United States, I needed to use applications of American banks and travel companies. But since my google ID was based in India, I wasn’t allowed to download these various applications in my smart-phone. After 3 days of exchanging emails and calls was my account finally allowed to use USA specific applications.

Solution: We all know that Google maintains a personalized location data on each user. It should use this data to determine the location of the user and allow them to use the applications specific to that country. Once the user leaves that region, google can once again block those applications to the user. This can allow the traveler to have a full thronged google experience – he can download apps of local banks, restaurants, hotels, travel agencies, etc.

Case 12

img-20161120-wa00041137

Problem: In almost every home in India, people use bolts and latches for door and windows. The above picture is from a window frame in my home back in India. The problem faced here is that certain type of wood used to make doors, windows and their frames is susceptible to expanding at varying degrees in humidity. Since a lot of regions in India experience extended monsoon, the expansion of wood often disturbs the alignment between bolts and their latches. This makes closing and opening of doors and windows difficult and sometimes outright impossible if the alignment is too far removed.

Solution: The manufacturer of furniture should use wood that has been processed and cleared for usage in humid environments. And the wood should be coated with an anti-humid material which prevents the wood from absorbing water vapors and expanding.

Social Networking Articles

Eco-friendly West Wing wins 2016 Shed of the year

This article informs about an eco friendly shed made just out of recycled and re-used materials. This stands in contrast with other man-made structures which are usually made from loads of manufactured bricks, plastic and cement, all of which have a considerable carbon footprint.

Its green roof is covered in wild turf and features a total of 400 used milk cartons, cut and layered for drainage. The interior includes a loft space, accessed by ladder, with a bed and an area to relax. One interesting feature is a bookcase that serves as a hidden door and reveals a secret room for his kids to play and sleep.

Made out of years of love, passion and hard work, this shed disabuses us of the fallacy that only steel and glass can make a beautiful structure.

Click here for the Reference Article.

Click here for the detailed discussion.

A Tablet for the Blind

The video tells us that the existing Braille digital technology has shortcomings such as the reader is allowed to read one line at a time and the technology is also very expensive. It costs around $4000 for the old one whereas this new technology tablet developed by the people at University of Michigan have developed this tablet which is cheaper than the existing technologies. This revolutionary tablet would eliminate all the complexities of Integrated wiring and circuit boards for high-definition display and GPU rendering, instead it would require some sort of physical/mechanical  controllers to control the movement of air bubbles or fluid. This fluid or air bubbles would need to be transferred to new positions on the tablet smoothly so the braille text is seamless and responsive.

Click here for the reference article.

Click here for the detailed discussion.

The First Glimpse Of A Sunken WWII Aircraft Carrier

Quite recently, scientists were able to use remotely operated vehicles to explore the USS Independence for the first time in 65 years. The ship is a world war-II era aircraft carrier which was deliberately sunk since it was one of the two aircraft carriers used in the nuclear bomb tests at Bikini toll island. A hellcat fighter plane was found well preserved on the deck along with the anti-aircraft gun. The researchers will conduct the study on how radioactivity affects corrosion and more importantly the effect it has had on maritime life surrounding the ship.

Click here for the reference article.

Click here for the detailed discussion.

Assignment 4

1. Discuss the eight principles of the ISO 9000 standard.

Eight principles of ISQ 9000 are the foundation of the Total Quality Management system, a family of standards and guidelines. These eight principles are as follows:

  1. Customer Focus: Understand the customer’s needs, meet the customer requirements and strive to exceed the expectations.
  2. Leadership: Establish unity of purpose and organizational direction and provide an environment that promotes employee involvement.
  3. Involvement of People: Take advantage of fully involved employees, using their abilities for the benefit of the organization.
  4. Process Approach: Recognize that things accomplished are the results of processes and that processes along with related activities and resources mush be managed.
  5. System Approach to Management: The multiple interrelated processes that contribute to the organization’s effectiveness are a system and should be managed as a system
  6. Continual Improvement: Continual improvement should be a permanent objective applied to the organization and to its people, processes, systems and products.
  7. Factual Approach to Decision Making: Decisions must be based on the analysis of accurate, relevant, and reliable data and information.
  8. Mutually beneficial Supplier Relationships: Both the organization and supplier benefiting from one another’s resources and knowledge results in value for all.

2. Discuss Pareto Charts.

Pareto Chart is a very useful tool whenever one needs to separate the important from the trivial. The use of the chart is based on Pareto Principle, which is also known as 80-20 principle. Eighty percent of the cost associated with the defects will be assignable to only about 20% of the total number of defect types occurring.

Pareto Principle  applies to all of us who have limited resources. This means that our resources need to be applied where they will do the most good. The purpose of the Pareto Chart is to show where to apply the resources by distinguishing the significant few from the trivial many.

1
4.1 Pareto Chart

In the figure on the left, there are five main customer contribute the most of the sales for the company. Seventy-five percent of this company’s sales are the result of A and B. If one adds customer C, 90% of its sales are accounted for. All others contributes less than 10%.  Obviously, A B and perhaps C are the company’s core market and all the other customers represent a marginal business.

3. Discuss fishbone diagrams.

Fishbone diagram gets its name because that is what it looks like. This diagram is also called cause-and-effect diagram to identify and isolate causes of a problem. According to the book Guide to Quality Control, the cause-and-effect diagrams have benefits as follows:

  • Creating the diagram itself is an enlightening, instructive process.
  • Such diagrams focus a group, thereby reducing irrelevant discussion.
  • Such diagrams separate causes from symptoms and force the issue of data collection.
  • Such diagrams can be used with any problem

The very basic fishbone diagrams is shown in the figure 4.2. And when we discuss about the defects causes, we might find out dozens of the causes like machine, solder, pre-heat, skill, humidity, parts and so on. We roughly divide these causes into several parts, like shown in figure 4.3. These are: Machine, Operator, Material, Environment, Methods, Measurements. Then plot all the detailed causes on the figure which is like figure 4.4.

2
4.2 Basic Fishbone Diagram
3
4.3 Fishbone Diagram with causes and effects


4
4.4 Causes and effects with complete relationships

The completed diagram reveals factors or relationships that had previously not been obvious. The diagram may suggest possibilities for action. It is conceivable in the example  that the team, because it is familiar with the plant’s operation. This diagram serves as an excellent reminder that the items noted on it are the things the company needs to pay attention to if the process continual improve.

4. Discuss histograms.

Histograms are used to chart frequency of occurrence. So histograms are also called frequency distribution diagrams. Both Attributes and variables data can be used in histograms.

An Attribute is something that the output product of the process either has or does not have.

Variables data are something that results from measurement.

A few basic facts in statistics are the foundation of the histograms which means all processes are subject to variability and variation. As shown in Figure 4.5, most of the frequency distribution diagrams is normal distributed while the mean value would be a vertical line to the peak of the bell curve. After calculating the mean of the data, we can also calculate the standard deviation. We can see in the Figure 4.6, the diagram is perfectly normal distributed with +/- 3 sigma. Even it seems the result is good enough, but in a competitive world, this is poor performance indeed.

5
4.5 Sample Frequency Distribution
6
4.6 Computation of Standard Deviation


There are also some other shapes of histogram but they are used in the special situation that most of us will not meet them very often.

7

8
4.7 Histograms of Different shapes

5. Discuss control chart for variables.

Control charts are the appropriate tool to monitor processes. The properly used control chart will immediately alert the operator to any change in the process. Having eliminated a problem’s root cause, that problem should never recur. Control charts also enable continual improvement of processes.

9
4.8 Basic Control Chart

Figure 4.8 shows a typical control chart. Data plotted over time. The data stay between the upper control limit and lower control limit while varying about the centerline or average only so long as the variation is the result of common causes. When there is a special cause impacts the process, either a plot point will penetrate UCL or LCL or there will be a run of  several points in a row above or below the average line. As long as the plots stay between the limits and don’t congregate on one side, the process is in statistical control. If either of these condition is not met, then we can say that the process is not in statistical control or out of control.

6. Discuss flowcharts and give a simple example

A Flowchart is a graphic representation of a process. A necessary step in improving a process is to flowchart it so that all parties involved can begin with the same understanding of the process. If the flowcharts given by different parties from the organization are not the same,  one significant problem is revealed that there is not a common understanding of the way the process works. Another common used strategy is ask team members to chart how the process actually works and then chart how they think it should work. A set of standard flowcharting symbols for communicating various actions, inputs, outflows and so on is used internationally. These symbols are shown in Figure 4.9.

10
4.9 Flowchart Symbology
11
4.10 Flowchart for finding the Square Root

Figure 4.10 is a flowchart used to find the square root for x=16 from MIT. This is a very basic program. As we can see, when ans=0, goes to decision module, where ans^2=0 < 16, so ans increases to 1 and go to the flow again. The program will do it over and over again, until ans=5, where ans^2 = 25 is greater than 16.  so the program will stop at ans=5 as the result.

7. Explain what is an FMEA

FMEA is the short for Failure Mode and Effects Analysis which tries to identify all possible potential failures of a product or process, prioritize them according to their risk and set in motion action to eliminate or reduce the probability of their occurrence. FMEA just tries to identify all the possible types of failures that could happen to a product or a process before they happen. Once the possible “failure modes” have been identified, the “effect analysis” kicks in and studies the potential consequences of those failures. There are several kinds of FMEA as below:

  1. Design FMEA is employed during the design phase of a product or service, starting at the very beginning of the project.
  2. Process FMEA is looking at the potential failures of a process.
  3. After-fact FMEA is leading to a retrofit or recall of the product if the problem is severe or simply to a design change for future production if the problem is not critical.

To fully understand what is a FMEA, we must understand its own unique of terms.

  • Failure Mode: The way in which something might fail.
  • Failure Effect: The failure’s consequence in terms of operation, function, or status of the item.
  • Effect Analysis: Studying the consequences of the various failure modes to determine their severity to the customer.
  • Failure Mode Analysis: An analytical technique used to evaluate failure modes with the intent to eliminate the failure mode in the future operations.

There are also some Risk Assessment Factors in the FMEA which are

  • Severity (S): A number from 1 to 10, depending on the severity of the potential failure mode’s effect where 1 is no effect.
  • Probability of Occurrence (O): A number from 1 to 10, depending on the likelihood of the failure mode’s occurrence where 1 is very unlikely to occur.
  • Probability of detection(D): A number from 1 to 10, depending on how unlikely it is that the fault will be detected by the system responsible where 1 is nearly certain detection.
  • Risk Priority Number (RPN): The failure mode’s risk is found by the formula RPN = S*O*D. It will be a number between 1 (virtually no risk) and 1,000 (extreme risk).

8. Provide an overview of the Toyota practical problem solving process.

Toyota practical problem solving process is helpful when reacting to an existent problem that has just come up or working to prevent future problems. There are seven steps in the process but in step 2, it includes several subprocesses which are shown in Figure 4.11.

12
4.11 Toyota’s Practical problem solving process

Perceive the intial problem. At this point, symptoms may be clear, but the problem may not be well defined.

  1. Clarify the problem. It is critical for problem solvers to fully grasp the situation before proceeding.
    • Observe the situation with an open mind.
    • Compare the actual to the standard.
    • Determine if variance exists.
    • Determine if multiple variance exist.
    • If multiple variance exist, prioritize by               severity.
    • Set an improvement objective.
  2. Determine the actual point of cause, using these questions.
    • Where do we observe the problem geographically?
    • Where is the cause geographically?
  3. Determine the root cause. use the Five-Why analysis.
    • Ask why the observed variance exist?
    • Ask why the answer to that question is as stated.
    • Repeat the why question at each succeeding level until the root cause is determined.
    • Use other total quality tools as appropriate.
  4. Develop and implement a countermeasure
  5. Evaluate the countermeasure’s effectiveness in solving the problem.
    • Evaluate by analysis before implement.
    • Achieve consensus that is  effective.
  6. Change the standard.

9. Explain a total quality decision-making process

Decision Making Process is a logically sequenced series of activities through which decisions are made. where decision-making means: Decision making is the process of selecting one course of action from among two or more alternatives.

13
4.12 Decision-Making Model

In general, about four steps in decision-making processes, detailed steps are presented in Figure 4.12

  • Identify or Anticipate the situation: Anticipating the situation is like driving defensively; never assume anything. Look, listen, ask and sense. The better managers know their employees, technological systems, products and processes, the better able they will be to anticipate troublesome situations.
  • Gather the Facts: Even the most perceptive manager will be unable to anticipate all situations or to understand intuitively what is behind them. Using methods and tools for control, manager should separate causes from symptoms and determine the root cause of the poor attitude. The inclusion of this step makes possible management by facts-a cornerstone of the total quality philosophy.
  • Consider Alternatives: It involves two steps: list all of the various alternative available and evaluate each alternative in light of the facts. The main criterion against which alternatives are evaluated is the desired outcome. Will the alternative being considered produce the desired result? If so, at what cost?
  • Choose the Best Alternative: Implement, Monitor and Adjust.  After all alternatives have been considered, one must be selected and implemented and after an alternative has been implemented, managers must monitor progress and adjust appropriately. Selecting the best alternative is never a completely objective process. It requires study, logic, reason, experience and even situation.

10. Explain why quality tools are important.

Quality Tools are important because quality is the foundation of survival in the business world. If we can choose the right quality tool(s), we will get our desired results or expectations while using less money and time.  From the establish of concept to the final mass production, a quality remained unsolved might cause ten times more money at each higher stage. With the right quality tools, we can solve the problems as early as possible.

Furthermore, there are a lot of quality tools for now and the selection of the right ones are sometimes confusing, especially at first. So Figure 4.13 shows a functionality matrix for the tools. The selection will be determined by which tool best satisfies the requirements. The knowledge of the task will often make the selection clear, although there may also be some trial and error involved initially. Once you start using them, you will find the selection to be virtually automatic.

14
4.13 Functionality Matrix for Quality tools

Social Networking Articles

Delphi, Mobileye Join Forces On Autonomous Car Platform

autonomous%20cars%20ap%20large%201In the month of September, amidst a flurry of announcements about partnerships between automobile industries and tech giants, Delphi Automotive – an electronics company and Mobileye – the Israeli software maker, joined hands to develop a fully autonomous driving platform in around two years.

Mobileye will provide with the latest chips which shall process data from different sensors and cameras, along with a software patch for real-time mapping of the vehicle’s surroundings. Delphi on the other hand, will provide the automated driving software algorithms and control systems for cameras, radar and laser sensors.

The partnership is the latest as old-line auto companies combine their strengths with technology companies as they try to stay competitive on autonomous cars. This spirit of competition and innovation is what motivates the industry players to come out with new technologies and services as the time goes by, which in turn pacifies the unabated yearning to customers to get their hands on the newest technology around.

Click here for the reference article

Click here for the group discussion.

Airbus Perlan II Awaits Right Conditions for Flight to 90,000 Feet

perlan_enders_flight_5-07-16_jsd_0533_medPerlan II is the second generation glider of the Perlan Project, which was originally founded as an aviation record-setting research project by NASA. In 2006, the Perlan I achieved its first flight to greater than 50,000 feet. Immediately following that flight the team envisioned a better, pressurized aircraft that could fly higher. The Perlan II is also equipped with scientific instruments that will be used for climate, aerospace and stratospheric research that cannot be measured via other means. Among the research related goals are to measure the atmospheric concentration of aerosols and greenhouse gases, including ozone, methane and water vapor. Perlan II will also collect data on exchanges between gases and energy within the two lower layers of the Earth’s atmosphere, the troposphere and stratosphere, according to the Perlan Project website.

Perlan II will be aero towed to the altitude of 9,000 feet. At this point, it will be released from tow into the mountain wave lift. It will be maneuvered as and when needed so that it remains in the area of rising air column. This mountain wave will elevate it to the altitude of 90,000 feet. The mountain waves are created by strong winds that blow over the top of high altitude mountains and are driven up towards space.

Along with its pressurized cabin and relatively low aspect ratio, a key feature for the success and validation of the Perlan II flight is its avionics, the LX-9000 integrated flight control computer. The moving map display function provided by the LX-9000 flight computer will aid the pilots in keeping the Perlan II within the lifting zones of the mountain waves.

LX-9000 is also key to proving that the Perlan II achieves the world record, as it is an International Gliding Commission (ICG)approved, high-altitude flight recorder. When turned on, it records a plethora of data for every minute of the aircraft’s flight, including pressure altitude and GPS altitude.

Click here for the reference article.

Click here for the group discussion.

Rockwell Collins Demonstrates Modernized Wideband HF ATG Connectivity

rockwell%20collins%20hf%20data%20transferThe U.S. Air Force and Rockwell Collins collaborated in a demonstration to transfer data from a C-17 airborne aircraft to a ground station over a Wideband High Frequency (WBHF) channel. The event took place over the duration of a two-day flight between Dover AFB Delaware and Joint Base Lewis-McChord, Washington, using a Wideband HF Receiver-Exciter configured for airborne operation.

The demonstration included the transfer of streaming video, real-time chat, file transfers, and digital voice audio. Over the two-day exercise, the teams were able to validate performance and reliability with changing variables that included the environment, geographical position, and time of day. Also demonstrated during this event, the transfer of data over a distance of more than 1,500 miles.

WBHF is a reliable solution for the transfer of data, including video, and a complement to traditional high-frequency satellite communications in denied environments.  Modernized Wideband HF (WBHF) can deliver rates up to 240 kpbs on a 48 kHz wide channel. The door is open for HF to provide the same levels of data transmission speeds, quality and security of a narrow-band SATCOM system. Rockwell Collins’ modernized HF capabilities, coupled with the inherent anti-jam nature of the widely dispersed nodes in Automatic Link Establishment (ALE) based HF networks, create an ideal alternative to narrow-band SATCOM in Anti-Access/Area Denial (A2/AD) battlefield environments.

Click here for the reference article

Click here for the group discussion