1. Discuss the eight principles of the ISO 9000 standard.
Eight principles of ISQ 9000 are the foundation of the Total Quality Management system, a family of standards and guidelines. These eight principles are as follows:
- Customer Focus: Understand the customer’s needs, meet the customer requirements and strive to exceed the expectations.
- Leadership: Establish unity of purpose and organizational direction and provide an environment that promotes employee involvement.
- Involvement of People: Take advantage of fully involved employees, using their abilities for the benefit of the organization.
- Process Approach: Recognize that things accomplished are the results of processes and that processes along with related activities and resources mush be managed.
- System Approach to Management: The multiple interrelated processes that contribute to the organization’s effectiveness are a system and should be managed as a system
- Continual Improvement: Continual improvement should be a permanent objective applied to the organization and to its people, processes, systems and products.
- Factual Approach to Decision Making: Decisions must be based on the analysis of accurate, relevant, and reliable data and information.
- Mutually beneficial Supplier Relationships: Both the organization and supplier benefiting from one another’s resources and knowledge results in value for all.
2. Discuss Pareto Charts.
Pareto Chart is a very useful tool whenever one needs to separate the important from the trivial. The use of the chart is based on Pareto Principle, which is also known as 80-20 principle. Eighty percent of the cost associated with the defects will be assignable to only about 20% of the total number of defect types occurring.
Pareto Principle applies to all of us who have limited resources. This means that our resources need to be applied where they will do the most good. The purpose of the Pareto Chart is to show where to apply the resources by distinguishing the significant few from the trivial many.

In the figure on the left, there are five main customer contribute the most of the sales for the company. Seventy-five percent of this company’s sales are the result of A and B. If one adds customer C, 90% of its sales are accounted for. All others contributes less than 10%. Obviously, A B and perhaps C are the company’s core market and all the other customers represent a marginal business.
3. Discuss fishbone diagrams.
Fishbone diagram gets its name because that is what it looks like. This diagram is also called cause-and-effect diagram to identify and isolate causes of a problem. According to the book Guide to Quality Control, the cause-and-effect diagrams have benefits as follows:
- Creating the diagram itself is an enlightening, instructive process.
- Such diagrams focus a group, thereby reducing irrelevant discussion.
- Such diagrams separate causes from symptoms and force the issue of data collection.
- Such diagrams can be used with any problem
The very basic fishbone diagrams is shown in the figure 4.2. And when we discuss about the defects causes, we might find out dozens of the causes like machine, solder, pre-heat, skill, humidity, parts and so on. We roughly divide these causes into several parts, like shown in figure 4.3. These are: Machine, Operator, Material, Environment, Methods, Measurements. Then plot all the detailed causes on the figure which is like figure 4.4.


The completed diagram reveals factors or relationships that had previously not been obvious. The diagram may suggest possibilities for action. It is conceivable in the example that the team, because it is familiar with the plant’s operation. This diagram serves as an excellent reminder that the items noted on it are the things the company needs to pay attention to if the process continual improve.
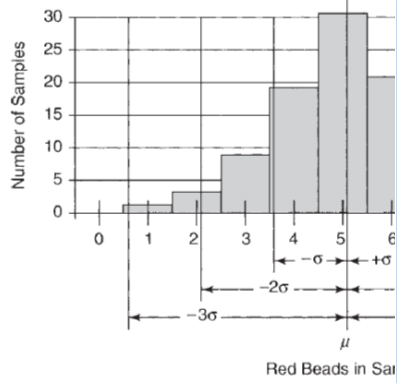
4. Discuss histograms.
Histograms are used to chart frequency of occurrence. So histograms are also called frequency distribution diagrams. Both Attributes and variables data can be used in histograms.
An Attribute is something that the output product of the process either has or does not have.
Variables data are something that results from measurement.
A few basic facts in statistics are the foundation of the histograms which means all processes are subject to variability and variation. As shown in Figure 4.5, most of the frequency distribution diagrams is normal distributed while the mean value would be a vertical line to the peak of the bell curve. After calculating the mean of the data, we can also calculate the standard deviation. We can see in the Figure 4.6, the diagram is perfectly normal distributed with +/- 3 sigma. Even it seems the result is good enough, but in a competitive world, this is poor performance indeed.

There are also some other shapes of histogram but they are used in the special situation that most of us will not meet them very often.


5. Discuss control chart for variables.
Control charts are the appropriate tool to monitor processes. The properly used control chart will immediately alert the operator to any change in the process. Having eliminated a problem’s root cause, that problem should never recur. Control charts also enable continual improvement of processes.

Figure 4.8 shows a typical control chart. Data plotted over time. The data stay between the upper control limit and lower control limit while varying about the centerline or average only so long as the variation is the result of common causes. When there is a special cause impacts the process, either a plot point will penetrate UCL or LCL or there will be a run of several points in a row above or below the average line. As long as the plots stay between the limits and don’t congregate on one side, the process is in statistical control. If either of these condition is not met, then we can say that the process is not in statistical control or out of control.
6. Discuss flowcharts and give a simple example
A Flowchart is a graphic representation of a process. A necessary step in improving a process is to flowchart it so that all parties involved can begin with the same understanding of the process. If the flowcharts given by different parties from the organization are not the same, one significant problem is revealed that there is not a common understanding of the way the process works. Another common used strategy is ask team members to chart how the process actually works and then chart how they think it should work. A set of standard flowcharting symbols for communicating various actions, inputs, outflows and so on is used internationally. These symbols are shown in Figure 4.9.


Figure 4.10 is a flowchart used to find the square root for x=16 from MIT. This is a very basic program. As we can see, when ans=0, goes to decision module, where ans^2=0 < 16, so ans increases to 1 and go to the flow again. The program will do it over and over again, until ans=5, where ans^2 = 25 is greater than 16. so the program will stop at ans=5 as the result.
7. Explain what is an FMEA
FMEA is the short for Failure Mode and Effects Analysis which tries to identify all possible potential failures of a product or process, prioritize them according to their risk and set in motion action to eliminate or reduce the probability of their occurrence. FMEA just tries to identify all the possible types of failures that could happen to a product or a process before they happen. Once the possible “failure modes” have been identified, the “effect analysis” kicks in and studies the potential consequences of those failures. There are several kinds of FMEA as below:
- Design FMEA is employed during the design phase of a product or service, starting at the very beginning of the project.
- Process FMEA is looking at the potential failures of a process.
- After-fact FMEA is leading to a retrofit or recall of the product if the problem is severe or simply to a design change for future production if the problem is not critical.
To fully understand what is a FMEA, we must understand its own unique of terms.
- Failure Mode: The way in which something might fail.
- Failure Effect: The failure’s consequence in terms of operation, function, or status of the item.
- Effect Analysis: Studying the consequences of the various failure modes to determine their severity to the customer.
- Failure Mode Analysis: An analytical technique used to evaluate failure modes with the intent to eliminate the failure mode in the future operations.
There are also some Risk Assessment Factors in the FMEA which are
- Severity (S): A number from 1 to 10, depending on the severity of the potential failure mode’s effect where 1 is no effect.
- Probability of Occurrence (O): A number from 1 to 10, depending on the likelihood of the failure mode’s occurrence where 1 is very unlikely to occur.
- Probability of detection(D): A number from 1 to 10, depending on how unlikely it is that the fault will be detected by the system responsible where 1 is nearly certain detection.
- Risk Priority Number (RPN): The failure mode’s risk is found by the formula RPN = S*O*D. It will be a number between 1 (virtually no risk) and 1,000 (extreme risk).
8. Provide an overview of the Toyota practical problem solving process.
Toyota practical problem solving process is helpful when reacting to an existent problem that has just come up or working to prevent future problems. There are seven steps in the process but in step 2, it includes several subprocesses which are shown in Figure 4.11.

Perceive the intial problem. At this point, symptoms may be clear, but the problem may not be well defined.
- Clarify the problem. It is critical for problem solvers to fully grasp the situation before proceeding.
- Observe the situation with an open mind.
- Compare the actual to the standard.
- Determine if variance exists.
- Determine if multiple variance exist.
- If multiple variance exist, prioritize by severity.
- Set an improvement objective.
- Determine the actual point of cause, using these questions.
- Where do we observe the problem geographically?
- Where is the cause geographically?
- Determine the root cause. use the Five-Why analysis.
- Ask why the observed variance exist?
- Ask why the answer to that question is as stated.
- Repeat the why question at each succeeding level until the root cause is determined.
- Use other total quality tools as appropriate.
- Develop and implement a countermeasure
- Evaluate the countermeasure’s effectiveness in solving the problem.
- Evaluate by analysis before implement.
- Achieve consensus that is effective.
- Change the standard.
9. Explain a total quality decision-making process
Decision Making Process is a logically sequenced series of activities through which decisions are made. where decision-making means: Decision making is the process of selecting one course of action from among two or more alternatives.
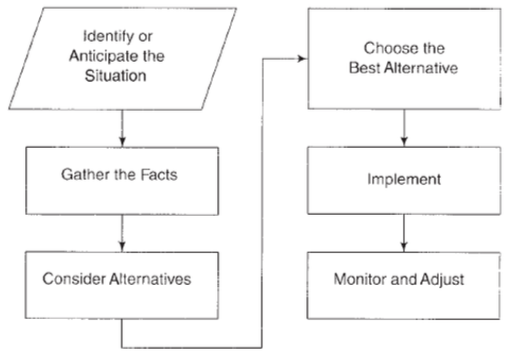
In general, about four steps in decision-making processes, detailed steps are presented in Figure 4.12
- Identify or Anticipate the situation: Anticipating the situation is like driving defensively; never assume anything. Look, listen, ask and sense. The better managers know their employees, technological systems, products and processes, the better able they will be to anticipate troublesome situations.
- Gather the Facts: Even the most perceptive manager will be unable to anticipate all situations or to understand intuitively what is behind them. Using methods and tools for control, manager should separate causes from symptoms and determine the root cause of the poor attitude. The inclusion of this step makes possible management by facts-a cornerstone of the total quality philosophy.
- Consider Alternatives: It involves two steps: list all of the various alternative available and evaluate each alternative in light of the facts. The main criterion against which alternatives are evaluated is the desired outcome. Will the alternative being considered produce the desired result? If so, at what cost?
- Choose the Best Alternative: Implement, Monitor and Adjust. After all alternatives have been considered, one must be selected and implemented and after an alternative has been implemented, managers must monitor progress and adjust appropriately. Selecting the best alternative is never a completely objective process. It requires study, logic, reason, experience and even situation.
10. Explain why quality tools are important.
Quality Tools are important because quality is the foundation of survival in the business world. If we can choose the right quality tool(s), we will get our desired results or expectations while using less money and time. From the establish of concept to the final mass production, a quality remained unsolved might cause ten times more money at each higher stage. With the right quality tools, we can solve the problems as early as possible.
Furthermore, there are a lot of quality tools for now and the selection of the right ones are sometimes confusing, especially at first. So Figure 4.13 shows a functionality matrix for the tools. The selection will be determined by which tool best satisfies the requirements. The knowledge of the task will often make the selection clear, although there may also be some trial and error involved initially. Once you start using them, you will find the selection to be virtually automatic.

Social Networking Articles
Delphi, Mobileye Join Forces On Autonomous Car Platform
 In the month of September, amidst a flurry of announcements about partnerships between automobile industries and tech giants, Delphi Automotive – an electronics company and Mobileye – the Israeli software maker, joined hands to develop a fully autonomous driving platform in around two years.
Mobileye will provide with the latest chips which shall process data from different sensors and cameras, along with a software patch for real-time mapping of the vehicle’s surroundings. Delphi on the other hand, will provide the automated driving software algorithms and control systems for cameras, radar and laser sensors.
The partnership is the latest as old-line auto companies combine their strengths with technology companies as they try to stay competitive on autonomous cars. This spirit of competition and innovation is what motivates the industry players to come out with new technologies and services as the time goes by, which in turn pacifies the unabated yearning to customers to get their hands on the newest technology around.
Click here for the reference article
Click here for the group discussion.
Airbus Perlan II Awaits Right Conditions for Flight to 90,000 Feet
 Perlan II is the second generation glider of the Perlan Project, which was originally founded as an aviation record-setting research project by NASA. In 2006, the Perlan I achieved its first flight to greater than 50,000 feet. Immediately following that flight the team envisioned a better, pressurized aircraft that could fly higher. The Perlan II is also equipped with scientific instruments that will be used for climate, aerospace and stratospheric research that cannot be measured via other means. Among the research related goals are to measure the atmospheric concentration of aerosols and greenhouse gases, including ozone, methane and water vapor. Perlan II will also collect data on exchanges between gases and energy within the two lower layers of the Earth’s atmosphere, the troposphere and stratosphere, according to the Perlan Project website.
Perlan II will be aero towed to the altitude of 9,000 feet. At this point, it will be released from tow into the mountain wave lift. It will be maneuvered as and when needed so that it remains in the area of rising air column. This mountain wave will elevate it to the altitude of 90,000 feet. The mountain waves are created by strong winds that blow over the top of high altitude mountains and are driven up towards space.
Along with its pressurized cabin and relatively low aspect ratio, a key feature for the success and validation of the Perlan II flight is its avionics, the LX-9000 integrated flight control computer. The moving map display function provided by the LX-9000 flight computer will aid the pilots in keeping the Perlan II within the lifting zones of the mountain waves.
LX-9000 is also key to proving that the Perlan II achieves the world record, as it is an International Gliding Commission (ICG)approved, high-altitude flight recorder. When turned on, it records a plethora of data for every minute of the aircraft’s flight, including pressure altitude and GPS altitude.
Click here for the reference article.
Click here for the group discussion.
Rockwell Collins Demonstrates Modernized Wideband HF ATG Connectivity
 The U.S. Air Force and Rockwell Collins collaborated in a demonstration to transfer data from a C-17 airborne aircraft to a ground station over a Wideband High Frequency (WBHF) channel. The event took place over the duration of a two-day flight between Dover AFB Delaware and Joint Base Lewis-McChord, Washington, using a Wideband HF Receiver-Exciter configured for airborne operation.
The demonstration included the transfer of streaming video, real-time chat, file transfers, and digital voice audio. Over the two-day exercise, the teams were able to validate performance and reliability with changing variables that included the environment, geographical position, and time of day. Also demonstrated during this event, the transfer of data over a distance of more than 1,500 miles.
WBHF is a reliable solution for the transfer of data, including video, and a complement to traditional high-frequency satellite communications in denied environments. Modernized Wideband HF (WBHF) can deliver rates up to 240 kpbs on a 48 kHz wide channel. The door is open for HF to provide the same levels of data transmission speeds, quality and security of a narrow-band SATCOM system. Rockwell Collins’ modernized HF capabilities, coupled with the inherent anti-jam nature of the widely dispersed nodes in Automatic Link Establishment (ALE) based HF networks, create an ideal alternative to narrow-band SATCOM in Anti-Access/Area Denial (A2/AD) battlefield environments.
Click here for the reference article
Click here for the group discussion


 Dyson introduced all-powerful air manipulator which incorporates the functionalities of air purifiction, heating and cooling. For purification purposes, it uses a 360-degreee HEPA filter which is capable of detecting pollutants such as pollens, molds and bacteria. The air quality parameters can be controlled via a Dyson link app, allowing users to monitor the air quality without having to walking up-to the air manipulator time and again. The funnel shape enables the air stream tto accelerate over an airfoil, thereby making the product more economical in terms of power consumption compared to a conventional fan used to maintain the air-flow over that same area. The only safety hazard I am worried about is that over the period of operation, inside surface of the funnel heats up. Making it dangerous in an environment with kids around.

 The Model S P100D with Ludicrous mode is the third fastest accelerating production car ever produced, with a 0-60 mph time of 2.5 seconds. the article linked below talks about development and the improvements with the battery life which provides an extra 10 kWh. This feature in turn enables the car to glide 315 miles in a single charge, making it a reliable long range electric car available in today’s automobile market.